Characterising the conservative/progressive divide

I’ve been thinking a little about the underlying differences between progressives/liberals and conservatives in the American (US) setting.  I’m not really thinking of opinions on economics or the ideal size of government, but views on economics and government would clearly be affected by what I describe.  Instead, I’m trying to imagine underlying bases for the competing social and political ideologies.

I’m not claiming any great insight, but it’s helped me clarify my thinking to imagine three overlapping areas of contention.  Each area helps inform the topic that follows in a manner that ought to be fairly clear:

  1. On epistemology and metaphysics.  Conservatives contend that there exist absolute truths which we can sometimes know, or even – at least in principle – always know.  In contrast, progressives embrace the postmodern view that there may not be any absolute truths and that, even if absolute truths do exist, our understanding of them is always relative and fallible.
  2. On the comparison of cultures[by “cultures”, I here include all traditions, ways of life, interactional mannerisms and social institutions in the broadest possible sense].  Conservatives contend that it is both possible and reasonable to compare and judge the relative worthiness of two cultures.  At an extreme, they suggest that this is plausible in an objective, universal sense.  A little more towards the centre, they alternately suggest that individuals may legitimately perform such a comparison to form private opinions.  Centrist progressives instead argue that while it might be possible to declare one culture superior to another, it is not reasonable to do so (e.g. because of the relative nature of truth).  At their own extreme, progressives argue that it is not possible to make a coherent comparison between two cultures.
  3. On changing one’s culture.  Conservatives suggest that change, in and of itself, is a (slightly) bad thing that must be justified with materially better conditions as a result of the change.  Progressives argue that change itself is neutral (or even a slightly good thing).  This leads to conflict when the material results of the change are in doubt and the agents are risk averse.  To the conservative mind, certain loss (from the act of changing) is being weighed against uncertain gain.  To the progressive mind, the act of change is a positive act of exploration which partially offsets the risks of an uncertain outcome.

Understanding John Yoo and the Bush presidency

Brad DeLong is continuing to maintain his stand against John Yoo.  To my mind, there is one clear way that John Yoo’s torture memos can be reconciled with his earlier writing on Clinton: He believes in the absolute primacy of the United States above all other nations.

Taking that as a postulate, placing US troops under foreign command becomes axiomatically unacceptable and was hence labelled unconstitutional [1], but allowing US agents to torture foreigners is acceptable, albeit unpleasant, because the victims are not American.

In practice, this becomes the application to the international stage of Richard Nixon’s famous 1977 quote, “when the President does it that means that it is not illegal.” Indeed, Condolezza Rice argued this exact point earlier this year (2009):

by definition, if it was authorized by the president, it did not violate our obligations under the Convention Against Torture.

This is simply the logical application (to the arena of military torture) of the belief that America should ignore all international agreements that constrain it in any way because to do otherwise would impugn the sovereignty of the greatest and purest nation in the history of mankind. You really have to admire their mental fortitude in failing to acknowledge the reductio ad absurdum that the Bush torture doctrine represented for that belief.

[1] To almost all Americans (including lawyers), the word “unconstitutional,” especially when applied in a political setting (and when is it not?), essentially means “against my ideology.”

An information-based approach to understanding why America let Lehman Brothers collapse but saved everyone afterwards

In addition to his previous comments on the bailouts [25 Aug27 Aug28 Aug], which I highlighted here, Tyler Cowen has added a fourth post [2 Sep]:

I side with Bernanke because an economy can withstand only so much major bank insolvency at once. Lots of major banks were levered up 30-1 or so. Their assets fell in value more than a modest amount and then they were insolvent, sometimes grossly so. (A three percent decline in asset values already puts you into insolvency range.) If AIG had gone into bankruptcy court, some major banks would have been even more insolvent. Or if Frannie securities had been allowed to find their non-bailout values. My guess is that at least 15 out of the top 20 U.S. banks would have been flat-out insolvent if, starting at the time of Bear Stearns, all we had done was loose monetary policy and no other bailouts. Subsequent contagion effects, and the shut down of short-term repo markets, and a run on money market funds, would have made even more financial institutions insolvent. The world as we know it then becomes very dire, both for credit reasons and deflation reasons (yes you can print up currency to keep measured M up and running but the economy still collapses). So we needed not just emergency lending but also resource transfers to banks, basically to put them back into the range of possible solvency.

I really like to see Tyler’s evolving attitudes here.  It lets me know that mere grad students are allowed to not be sure of themselves. 🙂  In any event, let me present my latest thoughts on the bailouts:

Imagine being Bernanke/Paulson two days before Lehman Brothers went down:  you know they’re going to go down if you don’t bail them out and you know that to bail them out creates moral hazard problems (i.e. increases the likelihood of a repeat of the entire mess in another 10 years).  You don’t know how close to the edge everyone else is, nor how large an effect a Lehman collapse will have on everyone else in the short-run (thanks, in no small part, to the fact that all those derivatives were sold over-the-counter), but you’re nevertheless almost certain that Lehman Brothers are not important enough to take down the whole planet.

In that situation, I think of the decision to let Lehman Brothers go down as an experiment to allow estimation of the system’s interconnectedness.  Suppose you’ve got a structural model of the U.S. financial system as a whole, but no empirical basis for calibrating it.  Normally you might estimate the deep parameters from micro models, but when derivatives were exempted from regulation in the 2000 Commodities Futures Modernization Act, in addition to letting firms do what they wanted with derivatives you also gave up having information about what they were doing.  So instead, what you need is a macro shock that you can fully identify so that at least you can pull out the reduced-form parameters.  Letting Lehman go was the perfect opportunity for that shock.

I’m not saying that Bernanke had an actual model that he wanted to calibrate (although if he didn’t, I really hope he has one now), but he will certainly have had a mental model.  I don’t even mean to suggest that this was the reasoning behind letting Lehman go.  That would be one hell of a (semi) natural experiment and a pretty reckless way to gather the information.  Nevertheless, the information gained is tremendously valuable, both in itself and to society as a whole because it is now, at least in part, public information.

To some extent, I feel like the ideal overall response to the crisis from the Fed and Treasury would have been to let everyone fail a little bit, but that isn’t possible — you can’t let an institution become a little bit bankrupt in the same way that you can’t be just a little bit pregnant.  To me, the best real-world alternative was to let one or two institutions die to put the frighteners on everyone and discover the degree of interconnectedness of the system and then save the rest, with the nature and scale of the subsequent bailouts being determined by the reaction to the first couple going down.  I would only really throw criticism at the manner of the saving of the rest (especially the secrecy) and even then I would be hesitant because:

(a) it was all terribly political and at that point the last thing Bernanke needed was a financially-illiterate representative pushing his or her reelection-centred agenda every step of the way (we don’t let people into a hospital emergency room when the doctor isn’t yet sure of what’s wrong with the patient);

(b) perhaps the calibration afforded by the collapse of Lehman Brothers convinced Bernanke-the-physician that short-term secrecy was necessay to “stop the bleeding” (although that doesn’t necessarily imply that long-term secrecy is warranted); and

(c) there was still inherent (i.e. Knightian) uncertainty in what was coming next on a day-to-day basis.

A pragmatic libertarian defense of the bank bailouts

Tyler Cowen is defending the bank bailouts in America: 25 Aug, 27 Aug, 28 Aug.  I generally like what he says.  I want to highlight the third post in particular:

General pro-market or anti-government arguments don’t rule out the recent bailouts.  Let’s take the hardest, least Friedman-friendly case, the insolvent banks.  For insolvent banks (and for some of the illiquid banks, which might have failed without bailouts), the alternative to those bailouts is calling in deposit insurance and the bankruptcy courts, both of which are, for better or worse, forms of government intervention.  In particular today’s bankruptcy procedures are ill-suited for disposing of a large financial institution in a timely manner and this can be considered a form of gross government failure.

Note that even when the Fed “bails out” a large investment bank, or insurance company, they are checking a chain reaction which would likely spread to some commercial banks, thus bringing in deposit insurance as well, not to mention further bankruptcies.  And that’s not even considering that Congress probably would have stepped in, I’m just looking at laws already on the books.

So if you’re “opposed to financial bailouts,” as a libertarian, you’re not for the market.  You’re saying that one scheme for governmental disposition is better than another.  Of course you are entitled to that opinion but the sheer force of libertarian doctrine is not necessarily on your side.  The general pro-market and anti-government arguments are not necessarily on your side.  I think it is quite plausible for a libertarian to believe that the Fed is “less bad” than the bankruptcy courts and the FDIC.

Now, all things considered, I don’t see why this “libertarian two-step” move should be needed.  I think it’s enough to simply ask whether the bailouts were a good idea and proceed accordingly.  But if you’re concerned about compatibility with libertarian principle, this is one simple way of seeing why my view fits right in.  In fact I think it is the more libertarian of the views under consideration, as it keeps the very worst of the government interventions on the table at bay.

No doubt some libertarians will counter that the FDIC and bankruptcy courts ought not to exist either (I disagree with that – while neither is perfect, they’re both needed.  But then, I’m hardly a libertarian), but that misses the point of Tyler’s title for the post:  “A second-best theory of libertarian bailouts”.  The world of second-best is the real world.  It accepts that things are currently as they are and asks what is best given the current state of the world, not in all possible worlds.

In which I respectfully disagree with Paul Krugman

Paul Krugman [Ideas, Princeton, Unofficial archive] has recently started using the phrase “jobless recovery” to describe what appears to be the start of the economic recovery in the United States [10 Feb, 21 Aug, 22 Aug, 24 Aug].  The phrase is not new.  It was first used to describe the recovery following the 1990/1991 recession and then used extensively in describing the recovery from the 2001 recession.  In it’s simplest form, it is a description of an economic recovery that is not accompanied by strong jobs growth.  Following the 2001 recession, in particular, people kept losing jobs long after the economy as a whole had reached bottom and even when employment did bottom out, it was very slow to come back up again.  Professor Krugman (correctly) points out that this is a feature of both post-1990 recessions, while prior to that recessions and their subsequent recoveries were much more “V-shaped”.  He worries that it will also describe the recovery from the current recession.

While Professor Krugman’s characterisations of recent recessions are broadly correct, I am still inclined to disagree with him in predicting what will occur in the current recovery.  This is despite Brad DeLong’s excellent advice:

  1. Remember that Paul Krugman is right.
  2. If your analysis leads you to conclude that Paul Krugman is wrong, refer to rule #1.

This will be quite a long post, so settle in.  It’s quite graph-heavy, though, so it shouldn’t be too hard to read. 🙂

Professor Krugman used his 24 August post on his blog to illustrate his point.  I’m going to quote most of it in full, if for no other reason than because his diagrams are awesome:

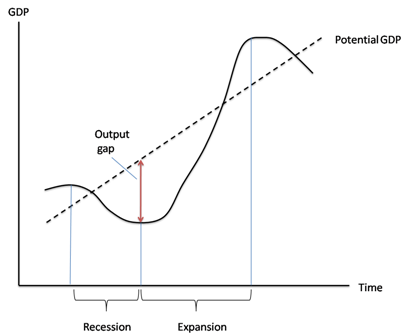
First, here’s the standard business cycle picture:

DESCRIPTION

Real GDP wobbles up and down, but has an overall upward trend. “Potential output” is what the economy would produce at “full employment”, which is the maximum level consistent with stable inflation. Potential output trends steadily up. The “output gap” — the difference between actual GDP and potential — is what mainly determines the unemployment rate.

Basically, a recession is a period of falling GDP, an expansion a period of rising GDP (yes, there’s some flex in the rules, but that’s more or less what it amounts to.) But what does that say about jobs?

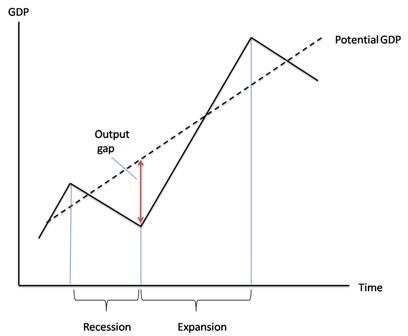
Traditionally, recessions were V-shaped, like this:

DESCRIPTION

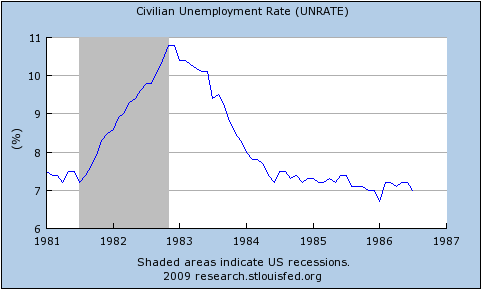
So the end of the recession was also the point at which the output gap started falling rapidly, and therefore the point at which the unemployment rate began declining. Here’s the 1981-2 recession and aftermath:

DESCRIPTION

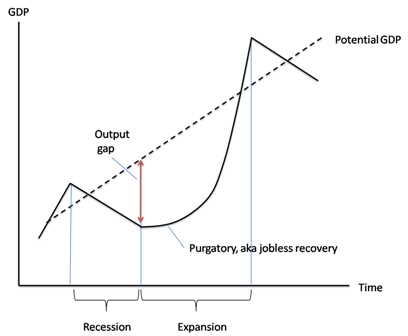
Since 1990, however, growth coming out of a slump has tended to be slow at first, insufficient to prevent a widening output gap and rising unemployment. Here’s a schematic picture:

DESCRIPTION

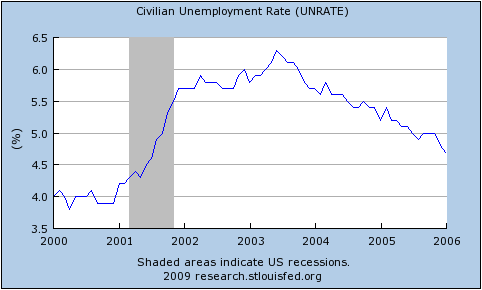
And here’s the aftermath of the 2001 recession:

DESCRIPTION

Notice that this is NOT just saying that unemployment is a lagging indicator. In 2001-2003 the job market continued to get worse for a year and a half after GDP turned up. The bad times could easily last longer this time.

Before I begin, I have a minor quibble about Prof. Krugman’s definition of “potential output.”  I think of potential output as what would occur with full employment and no structural frictions, while I would call full employment with structural frictions the “natural level of output.”  To me, potential output is a theoretical concept that will never be realised while natural output is the central bank’s target for actual GDP.  See this excellent post by Menzie Chinn.  This doesn’t really matter for my purposes, though.

In everything that follows, I use total hours worked per capita as my variable since that most closely represents the employment situation witnessed by the average household.  I only have data for the last seven US recessions (going back to 1964).  You can get the spreadsheet with all of my data here: US_Employment [Excel].  For all images below, you can click on them to get a bigger version.

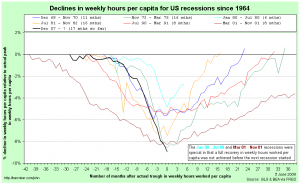
The first real point I want to make is that it is entirely normal for employment to start falling before the official start and to continue falling after the official end of recessions.  Although Prof. Krugman is correct to point out that it continued for longer following the 1990/91 and 2001 recessions, in five of the last six recessions (not counting the current one) employment continued to fall after the NBER-determined trough.  As you can see in the following, it is also the case that six times out of seven, employment started falling before the NBER-determined peak, too.
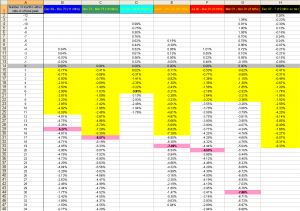
Hours per capita fell before and after recessions

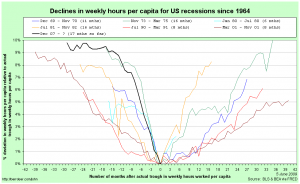
Prof. Krugman is also correct to point out that the recovery in employment following the 1990/91 and 2001 recessions was quite slow, but it is important to appreciate that this followed a remarkably slow decline during the downturn.  The following graph centres each recession around it’s actual trough in hours worked per capita and shows changes relative to those troughs:
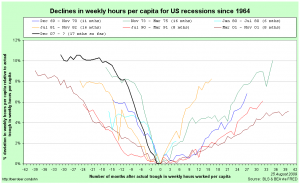
Hours per capita relative to and centred around trough

The recoveries following the 1990/91 and 2001 recessions were indeed the slowest of the last six, but they were also the slowest coming down in the first place.  Notice that in comparison, the current downturn has been particularly rapid.

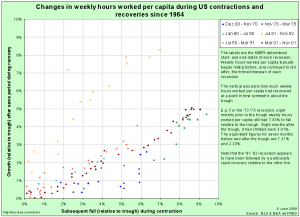
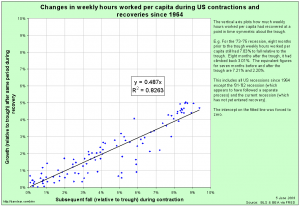
We can go further:  the speed with which hours per capita fell during the downturn is an excellent predictor of how rapidly they rise during the recovery.  Here is a scatter plot that takes points in time chosen symmetrically about each trough (e.g. 3 months before and 3 months after) to compare how far hours per capita fell over that time coming down and how far it had climbed on the way back up:
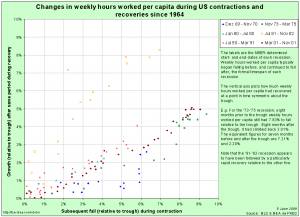
ComparingRecessions_20090605_Symmetry_Scatter_All

Notice that for five of the last six recoveries, there is quite a tight line describing the speed of recovery as a direct linear function of the speed of the initial decline.  The recovery following the 1981/82 recession was unusually rapid relative to the speed of it’s initial decline.  Remember (go back up and look) that Prof. Krugman used the 1981/82 recession and subsequent recovery to illustrate the classic “V-shaped” recession.  It turns out to have been an unfortunate choice since that recovery was abnormally rapid even for pre-1990 downturns.

Excluding the 1981/82 recession on the basis that it’s recovery seems to have been driven by a separate process, we get quite a good fit for a simple linear regression:
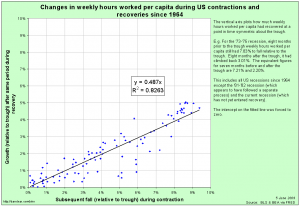
ComparingRecessions_20090605_Symmetry_Scatter_Excl_81-82

Now, I’m the first to admit that this is a very rough-and-ready analysis.  In particular, I’ve not allowed for any autoregressive component to employment growth during the recovery.  Nevertheless, it is quite strongly suggestive.

Given the speed of the decline that we have seen in the current recession, this points us towards quite a rapid recovery in hours worked per capita (although note that the above suggests that all recoveries are slower than the preceding declines – if they were equal, the fitted line would be at 45% (the coefficient would be one)).
A description of Australia’s healthcare system

John Hempton has gotten to it before I did and written it far better than I would have anyway.  Have a read.  Although I agree that Australia’s system is much, much better than America’s current system or any of their proposed frameworks, I would add three negative comments about Australia’s system:

  • Medicare payments to GPs for a consultation by a patient are determined centrally (at the federal level) and have not increased with inflation.  At first that meant that GPs shortened each consultation to fit more people in per day, but in the long run served, I believe, to reduce the supply of GPs and as a result pushed people with minor ailments to hospital emergency rooms.
  • I don’t know if it is better or worse than other countries, but the administrative overhead in the state government health departments is surprisingly large, even to me.  I am led to believe that adminstrators and middle-managers exceed more than 50% of the staff of Queensland Health (and that does not include admin staff on the wards).
  • The federal-state funding arrangement in Australia is a real problem.  I don’t know whether the best policy is to put all health care in federal hands or to grant the states more revenue-raising posibilities, but something does need to happen.

US government debt

Greg Mankiw [Harvard] recently quoted a snippet without comment from this opinion piece by Kenneth Rogoff [Harvard]:

Within a few years, western governments will have to sharply raise taxes, inflate, partially default, or some combination of all three.

Reading this sentence frustrated me, because the “will have to” implies that these are the only choices when they are not.  Cutting government spending is the obvious option that Professor Rogoff left off the list, but perhaps the best option, implicitly rejected by the use of the word “sharply“, is that governments stabilise their annual deficits in nominal terms and then let the real growth of the economy reduce the relative size of the total debt over time.  Finally, there is an implied opposition to any inflation, when a small and stable rate of price inflation is entirely desirable even when a country has no debt at all.

Heck, we can even have annual deficits increase every year, so long as the nominal rate of growth plus the accrual of interest due is less than the nominal growth rate (real + inflation) of the economy as a whole and you’ll still see the debt-to-GDP ratio falling over time.

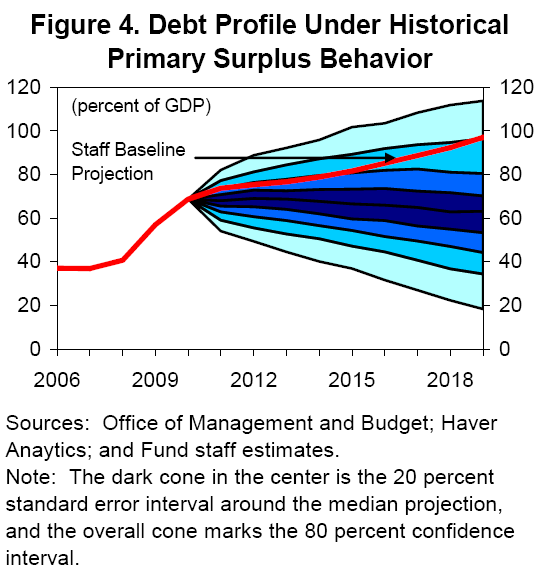
Via Minzie Chinn [U. of Wisconsin], I see that the IMF has a new paper looking at the growth rates of potential output, and the likely path of government debt in the aftermath of the credit crisis.  Using the the historical correlation between the primary surplus, debt, and output gap, they ran some stochastic simulations of how the debt-to-GDP ratio for America is likely to develop over the next 10 years.  Here’s the upshot (from page 37 of the paper):

IMF_US_debt_profile

Here is their text:

Combining the estimated historical primary surplus reaction function with stochastic forecasts of real GDP growth and real interest rates—and allowing for empirically realistic shocks to the primary surplus—imply a much more favorable median projection but slightly larger risks around the baseline. If the federal government on average adjusts the primary surplus as it has done in the past—implying a stronger improvement in the primary balance than under the baseline projections—the probability that debt would exceed 67 percent of GDP by year 2019 would be around 40 percent (Figure 4). Notably, with 80 percent probability, debt would be lower than the level it would reach under staff’s baseline by 2019. [Emphasis added]

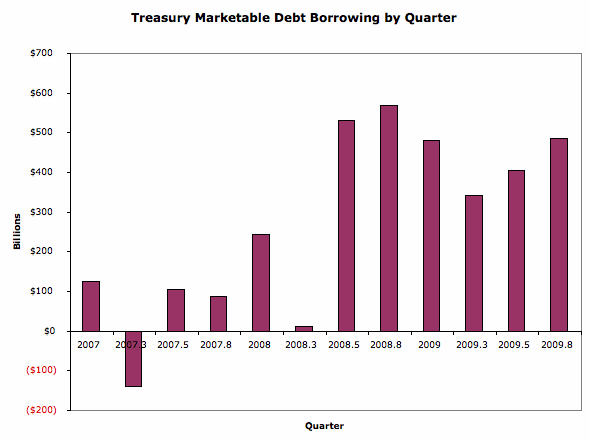
So I am not really worried about debt levels for America.  To be frank, neither is the the market, either, despite what you might have heard.  How do I know this?  Because the market, while clearly not perfectly rational, is rational enough to be forward-looking and if they thought that US government debt was a serious problem, they wouldn’t really want to buy any more of that debt today.  But the US has been selling a lot of new bonds (i.e. borrowing a lot of money) lately and the prices of government bonds haven’t really fallen, so the interest rates on them haven’t really gone up.  Here is Brad DeLong [Berkeley]:

[A] sharp increase in Treasury borrowings is supposed to carry a sharp increase in interest rates along with it to crowd out other forms of interest sensitive spending, [but it] hasn’t happened. Hasn’t happened at all:

Treasury marketable debt borrowing by quarterTreasury yield curve

It is astonishing. Between last summer and the end of this year the U.S. Treasury will expand its marketable debt liabilities by $2.5 trillion–an amount equal to more than 20% of all equities in America, an amount equal to 8% of all traded dollar-denominated securities. And yet the market has swallowed it all without a burp…

I don’t want to bag on Professor Rogoff. The majority of his piece is great: it’s a discussion of fundamental imbalances that need to be dealt with. You should read it. It’s just that I’m a bit more sanguine about US government debt than he appears to be.

Culinary delights of Washington, D.C.

Half the reason for our recent trip to America was to visit friends in D.C.  Photos for our gallery or facebook will have to wait until Dani gets back, but I thought I’d share a few thoughts on eating in Washington:

  • Tyler Cowen knows what he’s talking about.  The complete version of his dining guide in a single page is here.
  • I ate buffalo (okay, okay. “american bison”) for the first and second time.  The first was in the wonderfully thought out food hall of the National Museum of the American Indian.  The second was in the form of a burger on the rooftop terrace of one of our friends.  Good times.
  • The cupcakes at Georgetown Cupcake are delicious (and well worth the wait in line), but they’re not quite as good as those from the Primrose Bakery here in London.
  • The sandwiches at Dean & DeLuca are pretty damn fine.
  • The burgers at Ray’s Hell Burger (how do they not have their own website?) are utterly incredible.  I can have my burger au poivre?  With Foie Gras?  My mouth is watering just remembering it.
  • Be careful that the Ethopian restaurant you choose doesn’t slap you with $6 + tax + tip cokes (it was in the fine print of the menu).  Nevertheless, you’d be crazy to miss some Ethopian while you were there.
  • The crab cakes in Annapolis, MD are the perfect excuse for a day trip.
  • But hands down, the best food I had in D.C. — our friend Maria’s pasta aside, of course — was at Thai X-ing.  It is one guy in the basement of a house.  It’s freaking tiny and easily the best Thai food I have ever, ever eaten.  Here are two photos that I took on my phone (Click on each for a bigger version.  I apologise for the poor quality – the iPhone 3G only has a 1 megapixel camera and the receptor is hardly impressive):
    The kitchen at Thai X-ing

    Dani and Maria at Thai X-ing

    We somehow managed to fit eight people in the space behind Dani and Maria (the bird cage was moved). The cooking is really slow, so the thing to do is to place your order the day before you go if you’re going to eat there. Unbelievably cheap. I refuse to recommend a single dish.

Culinary delights of Atlanta, GA

I’ve recently returned from America where, among other things, Dani and I went to the wedding of two of our best friends. On the day of the wedding, the groom’s uncle continued a family tradition by taking the groom and 30 or 40 of his closest male kith and kin out to lunch. While there I had the great pleasure of encountering a new (to me) Southern dish:

A quite spicy (but not obscenely so) Jalepeno pepper, stuffed with shrimp, wrapped in bacon and deep fried on a stick.

I managed three, but should probably have stopped at two. Fantastic. I only wish I’d had the sense to take a photograph.

On the symmetry of employment contraction and recovery in US recessions

A couple of days ago I gave some graphs depicting movements in weekly hours worked per capita during US recessions since 1964.  Towards the end, I gave this graph:

Comparing US recessions in hours worked per capita, centred around their troughs

I thought it might be worthwhile to look at this idea further.  Here is the equivalent graph where movements in hours worked per capita are made relative to their actual troughs rather than their actual peaks:

Comparing US recessions in hours worked per capita, centred around and relative to their troughs

At a first glance, recoveries do appear to be somewhat symmetric to their corresponding contractions, although they do also appear to be a bit slower coming back up to falling down in the first place.

I then identified data pairs that are symmetric in time around each trough (e.g. 3 months before and after the trough) and put them in a scatter-plot:

Scatter plot of falls-to-come in weekly hours per capita against subsequent gains in recovery

Points along the 45-degree line here would represent recoveries that were perfectly symmetric with their preceding contraction.  Notice that for five of the six recessions shown, recoveries are in a fairly tight line below the 45-degree line.  By comparison, the recovery following the ’81-’82 recession was especially rapid – it came back up faster than it fell down.

Excluding the ’81-’82 recession on the basis that it’s recovery seems to have been driven by a separate process, a simple linear regression gives a remarkably good fit:

comparingrecessions_20090605_symmetry_scatter_excl_81-82

This is a very rough-and-ready analysis.  In particular, I’ve not allowed for any autoregressive component to employment growth during the recovery.  Nevertheless, it is suggestive.

There are more serious efforts in looking at this for the economy as a whole (rather than just hours worked).  James Hamilton is not convinced that it will occur this time.  The oddly rapid recovery in hours worked per capita following the ’81-’82 recession should give us reason to agree with Professor Hamilton, not disagree: it shows that the typical recovery is not guaranteed.  Look back at the scatter-plot of all the recessions.  Notice that the recovery following the ’69-’70 recession was actually quite slow.  It’s fitted line is y = 0.252 x.

For me, the big thing that makes me lean towards Professor Hamilton’s fears of a slower-than-typical recovery is the possibility of zombie banks, or as John Hempton argues, zombie borrowers.  Zombie borrowers should worry us because, if they exist, they are keeping hold of the capital that could (and should) be better placed elsewhere in the economy, which means that those more deserving would-be borrowers are not able to expand and employ more people.

As Hempton argues in the second of his posts, on this basis it is a Good Thing ™ that two of the three US car manufacturers have been forced into a bankruptcy-induced contraction.  Note that Ford only really managed to avoid the same fate by borrowing a huge amount just before the credit markets froze.  It probably needs (from the point of view of the economy as a whole) to follow the same process, whether inside or outside the courts.

But the car manufacturers are by no means the only candidates for the “zombie borrower” epithet.  The really big borrower behind all of the mess in the financial sector is the one at the bottom of all the “toxic” CDOs:  the underwater American households.