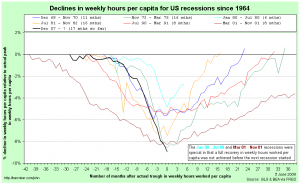
A couple of days ago I gave some graphs depicting movements in weekly hours worked per capita during US recessions since 1964. Towards the end, I gave this graph:
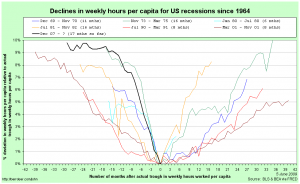
I thought it might be worthwhile to look at this idea further. Here is the equivalent graph where movements in hours worked per capita are made relative to their actual troughs rather than their actual peaks:
At a first glance, recoveries do appear to be somewhat symmetric to their corresponding contractions, although they do also appear to be a bit slower coming back up to falling down in the first place.
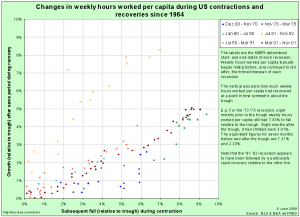
I then identified data pairs that are symmetric in time around each trough (e.g. 3 months before and after the trough) and put them in a scatter-plot:
Points along the 45-degree line here would represent recoveries that were perfectly symmetric with their preceding contraction. Notice that for five of the six recessions shown, recoveries are in a fairly tight line below the 45-degree line. By comparison, the recovery following the ’81-’82 recession was especially rapid – it came back up faster than it fell down.
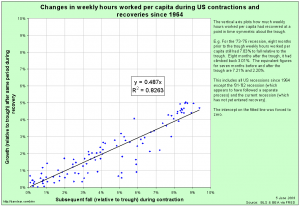
Excluding the ’81-’82 recession on the basis that it’s recovery seems to have been driven by a separate process, a simple linear regression gives a remarkably good fit:
This is a very rough-and-ready analysis. In particular, I’ve not allowed for any autoregressive component to employment growth during the recovery. Nevertheless, it is suggestive.
There are more serious efforts in looking at this for the economy as a whole (rather than just hours worked). James Hamilton is not convinced that it will occur this time. The oddly rapid recovery in hours worked per capita following the ’81-’82 recession should give us reason to agree with Professor Hamilton, not disagree: it shows that the typical recovery is not guaranteed. Look back at the scatter-plot of all the recessions. Notice that the recovery following the ’69-’70 recession was actually quite slow. It’s fitted line is y = 0.252 x.
For me, the big thing that makes me lean towards Professor Hamilton’s fears of a slower-than-typical recovery is the possibility of zombie banks, or as John Hempton argues, zombie borrowers. Zombie borrowers should worry us because, if they exist, they are keeping hold of the capital that could (and should) be better placed elsewhere in the economy, which means that those more deserving would-be borrowers are not able to expand and employ more people.
As Hempton argues in the second of his posts, on this basis it is a Good Thing ™ that two of the three US car manufacturers have been forced into a bankruptcy-induced contraction. Note that Ford only really managed to avoid the same fate by borrowing a huge amount just before the credit markets froze. It probably needs (from the point of view of the economy as a whole) to follow the same process, whether inside or outside the courts.
But the car manufacturers are by no means the only candidates for the “zombie borrower” epithet. The really big borrower behind all of the mess in the financial sector is the one at the bottom of all the “toxic” CDOs: the underwater American households.


Could you please send me an email… through the blog.
John Hempton
Wow! – This page is chock-full of good stuff!
I’ve only skimmed it (haven’t quite “digested” all of it yet), but your explanations & examples make great sense, and I like your approach(es).
And, especially, thanks for making the spreadsheet of the data available!
Based on the observation that I think I saw here first that employment hadn’t recovered to pre-recession levels before the next recession only twice, I’m now thinking the 1979- recession was a W with that extended from 79 through to 83, with Reagan’s polcies extending the recession. This is essentially applying the logic of those who argue FDR’s policies delayed the recovery, and extended the Great Depression, to 40-41.
And the current recession is really just the second done leg of the W of the 2000-1 to present recession, extended by Bush’s policies.