Monetary policy, fear of commitment and the power of infinity

This is a fascinating time to be thinking about monetary policy…

Like everybody else, central banks can do two things:  they can talk, or they can act.

Some people say that talk is cheap and, in any event, discretion implies bias.

Other people point out that things like central bankers’ concern for their reputation mean that it’s perfectly possible to promise today to implement history-dependent policy tomorrow. Some cheeky people like to point out that this amounts to saying that, when in a slump, a central bank should “credibly commit to being irresponsible” in the future.

In fact, some people argue (pdf) that, in my words, “all monetary policy is, fundamentally, about expectations of the future.”  But if that’s the case, why act at all? Why not just talk and stay away from being a distorting influence in the markets?

There are two reasons: First, since since talk is cheap, credibility requires that people know that you can and, if necessary, will act to back it up (talk softly and carry a big stick). Second, because if you can convince people with actions today, you don’t need to explicitly tell them what your policy rule will be tomorrow and central bankers love discretion because no rule can ever capture what to do in every situation and well, hey … a sense of mystery is sexy.

OMO stands for “Open Market Operation”. It’s how a central bank acts.  Some scallywags like to say that when a central bank talks, it’s an “Open Mouth Operation.” Where it gets fun (i.e. complicated) is that often a central bank’s action can be just a statement if the stick they’re carrying to back it up is big enough.

In regular times, a typical central bank action will be to announce an interest rate and a narrow band on either side of it. In theory, it could be any interest rate at all, but in practice they choose the interest rate for overnight loans between banks. They then commit to accepting in or lending out infinite amounts of money if the interest rate leaves that narrow band. Infinity is a very big stick indeed, so people go along with them.

So what should a central bank do when overnight interest rates are at (or close to) zero and the central bank doesn’t want to take them lower, but more stimulus is needed?

Woodford-ites say that you’ve got to commit, baby. Drop down to one knee, look up into the economy’s eye and give the speech of your life. Tell ’em what you promise to do tomorrow. Tell ’em that you’ll never cheat.  Pinky-swear it … and pray that they believe you.

Monetarists, on the other hand, cough politely and point out that the interest rate on overnight inter-bank loans is just a price and there are plenty of other prices out there. The choice of the overnight rate was an arbitrary one to start with, so arbitrarily pick another one!

Of course, the overnight rate wasn’t chosen arbitrarily. It was chosen because it’s the price that is the furthest away from the real economy and, generally speaking, central bankers hate the idea of being involved in the real economy almost as much as they love discretion. They watch it, of course. They’re obsessed by it. They’re guided by it and, by definition, they’re trying to influence it, but they don’t want to be directly involved. A cynic might say that they just don’t want to get their hands dirty, but a realist would point out that no matter the pain and joy involved in individual decisions in the economy, a cool head and an air of abstraction are needed for policy work and, in any event, a central banker is hardly an industrialist and is therefore entirely unqualified to make decisions at the coalface.

But as every single person knows, commitment is scary, even when you want it, so the whole monetarist thing is tempting. Quantitative Easing (QE) is a step along that monetarist approach, but the way it’s been done is different to the way that OMOs usually work. There has been no target price announced and while the quantities involved have been big (even huge), they have most definitely been finite. The result? Well, it’s impossible to really tell because we don’t know how bad things would have been without the QE. But it certainly doesn’t feel like a recovery.

Some transmission-mechanism plumbers think that the pipes are clogged (see also me).

Woodford-ites say that it’s because there’s no love, baby. Where’s the commitment?

Monetarists say that infinity is fundamentally different to just a really big number.

Market monetarists, on the other hand (yes, I’m sure you were wondering when I’d get to them), like to argue that the truth lies in between those last two. They say that it’s all about commitment (and without commitment it’s all worthless), but sometimes you need an infinitely big stick to convince people. They generally don’t get worked up about how close the central bank’s actions are to the real economy and they’re not particularly bothered with concrete steps.

So now we’ve got some really interesting stuff going on:

The Swiss National Bank (a year ago) announced a price and is continuing to deploy the power of infinity.

The European Central Bank has switched to infinity, but is not giving a price and is not giving any forward guidance.

The Federal Reserve has switched to infinity and is giving some forward guidance on their policy decision rule.

The Bank of England is trying to fix the plumbing.

It really is a fascinating time to be thinking about this stuff.

Woodford, QE and the BoE’s FLS

I’ve been thinking a bit about the efficacy of QE, the potential benefits of the Bank of England’s Funding for Lending Scheme (FLS) [BoE, HM Treasury] and the new paper Michael Woodfoord presented at Jackson Hole [pdf here] (it’s a classic Woodford paper, by the way, even if it is is almost entirely equation free: a little difficult to wrap your head around, but ultimately very, very insightful).  Woodford’s conclusion starts with an excellent statement of the problem:

Central bankers confronting the problem of the interest-rate lower bound have tended to be especially attracted to proposals that offer the prospect of additional monetary stimulus while (i) not requiring the central bank to commit itself with regard to future policy decisions, and (ii) purporting to alter general financial conditions in a way that should affect all parts of the economy relatively uniformly, so that the central bank can avoid involving itself in decisions about the allocation of credit.

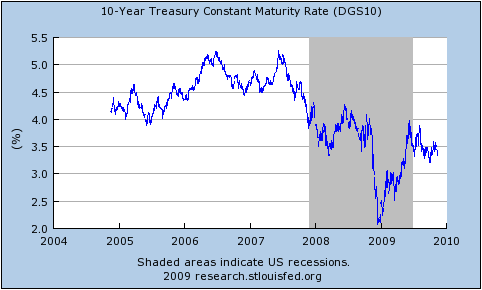
The interest-rate lower bound here is not necessarily zero, but rather whatever rate is paid on excess reserves, which may indeed be equal to zero, but need not be.  In the US, interest on reserves for depository institutions has been 0.25% since Oct 2008; in the UK it has been Bank Rate, currently 0.5%, since Mar 2009.  In principle, one might push the interest rate paid on reserves into negative territory, but such an action would come at the cost of destroying a subset of the money market and with a very real risk that economic agents (banks or, worse, businesses and households) would instead choose to hold their money in the form of physical currency.

Woodford advocates a strong form of forward guidance — that is, the abandonment of restriction (i) — as the optimal policy at the present time, on the basis that all monetary policy is, fundamentally, about expectations of the future.  In particular, he uses the paper to make an argument for nominal GDP level targeting.

This is vitally important stuff, but in this post I want to talk about quantitative easing, in the general sense of the phrase, or what Woodford far more accurately refers to as “balance sheet policies.”

First up is the purchase of short-dated safe assets, paid for with the creation of new reserves.  For the financial sector, this means giving up a safe, liquid asset with a steady revenue stream in return for money.  In normal times, the financial sector might then seek to increase their lending, providing a multiplier effect, but with interest rates on short-dated safe assets at the same level as interest paid on reserves, the financial position of the bank does not change with the purchase, so their incentive to lend can’t increase.  In this case, the short-dated safe asset has become a perfect substitute for money and, absent any forward guidance, such a policy can have no effect on the real economy.  Krugman (1998) and Eggertson and Woodford (2003) provide two-period and infinite-horizon treatments respectively.  Forward guidance in this setting might be anything from the private sector observing the purchases and inferring a more accommodative policy stance in the future (and the central bank doing nothing to disabuse them of that belief) to an outright statement from the central bank that the increase in reserves will be permanent.

Next up is the idea of purchasing long-dated safe assets, or even long-dated risky assets.  Woodford stresses that this can be decomposed into two distinct parts:  An initial expansion of the central bank’s balance sheet via the purchase of short-dated, safe assets and then an adjustment of the composition of the balance sheet by selling short-dated safe assets and buying long-dated assets.  Since the first step is thought to be ineffective (by non-Monetarists, at least), any traction should be obtained in the second step.

But because the second step represents either an adjustment in the relative supply of short- and long-dated government debt (in the case of limiting oneself to safe assets) or an allocation of capital directly to the real economy (in the case of purchasing risky assets), this is arguably fiscal policy rather than monetary and should perhaps be better done by the Treasury department.  Putting that concern to one side, I want to consider why it might, or might not, work.

The standard argument in favour is that of portfolio rebalancing: now holding extra cash and facing low yields on long-dated safe assets, a financial actor seeking to equate their risk-adjusted returns across assets should choose to invest at least some of the extra cash in risky assets (i.e. lending to the real economy).  Woodford emphasises that this story implicitly requires heterogeneity across market participants:

But it is important to note that such “portfolio-balance effects” do not exist in a modern, general-equilibrium theory of asset prices — in which assets are assumed to be valued for their state-contingent payoffs in different states of the world, and investors are assumed to correctly anticipate the consequences of their portfolio choices for their wealth in different future states — at least to the extent that financial markets are modeled as frictionless. It is clearly inconsistent with a representative-household asset pricing theory (even though the argument sketched above, and many classic expositions of portfolio-balance theory, make no reference to any heterogeneity on the part of private investors). In the representative-household theory, the market price of any asset should be determined by the present value of the random returns to which it is a claim, where the present value is calculated using an asset pricing kernel (stochastic discount factor) derived from the representative household’s marginal utility of income in different future states of the world. Insofar as a mere re-shuffling of assets between the central bank and the private sector should not change the real quantity of resources available for consumption in each state of the world, the representative household’s marginal utility of income in different states of the world should not change. Hence the pricing kernel should not change, and the market price of one unit of a given asset should not change, either, assuming that the risky returns to which the asset represents a claim have not changed.

He goes on to stress that if the central bank were to take some risk off the private sector, the risk still remains and, in the event of a loss, the reduction in central bank profits to the treasury would require a subsequent increase in taxes. Consequently, a representative household would experience the loss no matter whether it was formally held by itself or the central bank.  Crucially, too …

The irrelevance result is easiest to derive in the context of a representative-household model, but in fact it does not depend on the existence of a representative household, nor upon the existence of a complete set of financial markets. All that one needs for the argument are the assumptions that (i) the assets in question are valued only for their pecuniary returns [John here: i.e. their flow of revenue and their expected future resale value] — they may not be perfect substitutes from the standpoint of investors, owing to different risk characteristics, but not for any other reason — and that (ii) all investors can purchase arbitrary quantities of the same assets at the same (market) prices, with no binding constraints on the positions that any investor can take, other than her overall budget constraint. Under these assumptions, the irrelevance of central-bank open-market operations is essentially a Modigliani-Miller result.

[…]

Summing over all households, the private sector chooses trades that in aggregate precisely cancel the central bank’s trade. The result obtains even if different households have very different attitudes toward risk, different time profiles of income, different types of non-tradeable income risk that they need to hedge, and so on, and regardless of how large or small the set of marketed securities may be. One can easily introduce heterogeneity of the kind that is often invoked as an explanation of time-varying risk premia without this implying that any “portfolio-balance” effects of central-bank transactions should exist.

Of the two requirements for this irrelevance result, the second is clearly not true in practice, so large-scale asset purchases should, in principle, work even in the absence of any forward guidance, although the magnitude of the efficacy would be in doubt.

On the first, Woodford does acknowledge some work by Krishnamurthy and Vissing-Jorgensen (2012) which shows that US government debt possesses non-pecuniary qualities that are valued by the financial sector.  In particular, safe government debt is often required as collateral in repo transactions and this requirement should give such assets value above that implied by their pure pecuniary returns.  However, as pointed out by Krishnamurthy and Vissing-Jorgensen in a discussion note (pdf), to the extent that this channel is important, it implies that central bank purchases of long-dated safe assets can even be welfare reducing.

To see why this is so, I think it best to divide the universe of financial intermediaries into two groups:  regular banks and pure investment shops.  Pure investment shops have, collectively, particularly stable funding (think pension funds) although the funds might swoosh around between individual investment shops.  Regular banks have some stable funding (from retail deposits), but also rely on wholesale funding.

Up until the financial crisis of 2008, regular banks’ wholesale funding was done on an unsecured basis.  There was no collateral required.  There was very little asset encumbrance.  But since the crisis (and, indeed, arguably because of it), regular banks have had essentially no access to unsecured lending.  Instead, banks have been forced to rely almost entirely on secured borrowing (e.g. through covered bonds at the long end or repos at the short end) for their wholesale funding.  In addition to this, new regulations have been (or are being) put in place that increase their need to hold safe assets (i.e. government debt) even if unsecured borrowing is available.

QE has therefore acted through two, broad channels.  In the first, portfolio rebalancing may still have worked through the pure investment shops.  Having sold their government bonds and now holding cash, they reinvested the money but since the yields on government bonds were now lower relative to other asset classes, they put a larger fraction of that money into equity and corporate bond markets.  To the extent that such investment shops are not able to perfectly offset the central bank’s trade, or are unable to full recognise their need to bear any potential losses from any risk the central bank takes on, large non-financial companies (NFCs) with access to stock and bond markets should therefore have seen a reduction in the price of credit and, in principle, should have been more willing to undertake investment.

On the other hand, QE has also served to lower the supply of eligible collateral at precisely the time when demand for it among regular banks has shot up.  The banks have then been faced with an awful choice:  either pay the extra high cost to get the required collateral (buying it off the pure investment shops), or deleverage so that they don’t need the funding any more.  As a result, their funding costs will have gone up as a direct result of QE and if they have any pricing power at all (and they do), then interest rates available to households and small-to-medium sized enterprises (SMEs) will be forced to be higher than they would otherwise have been.  No matter which option banks choose (and most likely they would choose a combination of the two), a negative supply (of credit) shock to the real economy would occur as a result.

If this second broad channel (through regular banks) were to outweigh the first (through pure investment shops), then QE focused on the purchase of long-dated safe assets would, in aggregate, have a negative effect on the economy.  I believe it is this very possibility that has given both the Federal Reserve and the Bank of England pause in their consideration of additional asset purchases.

Of course, if the central bank were not to buy long-dated safe assets but were instead to purchase long-dated risky assets (bundles of corporate bonds, MBS, etc), the supply of safe assets needed for collateral purposes would not be artificially reduced and, to the extent that portfolio rebalancing helps at all, the full efficacy would be obtained.   However, such a strategy would go against the principle that central banks ought to stay away from the decisions regarding the allocation of credit.

All of which is why, I suspect, that the Bank of England has decided to go for their Funding for Lending Scheme.  At it’s heart, the FLS is a collateral swap.  The BoE gives banks gilts and the banks give the BoE bundles of their mortgages and SME loans, plus interest.  The banks can then use the gilts to obtain funding on the wholesale market, while the interest that banks pay the BoE is a decreasing function of how much additional lending the banks make to the real economy.  The mortgages and SME loans that the banks give the BoE will have a haircut applied for safety.  It’ll be pretty tricky to get just right, but in principle it should be able to offset any increase in funding costs that QE may have imposed.

A clear majority of credit creation in Britain takes place via regular banks, so this has the potential to have quite a dramatic effect.  We’ll just have to wait and see …

Glenn Stevens is not quite God

Alan Kohler has a piece on Crikey talking about electricity prices in Australia.  It’s an interesting piece and well worth a read, but it’s got a crucial economics mistake.  After talking about the politics and such, Alan gets down to brass tacks, telling us that:

  • Over the last two years, electricity prices in Australia have risen by 48% on average; and
  • Indeed, over the last five years, electricity prices have risen by more than 80% on average; but
  • Over the last twelve months, overall inflation has only been 1.5%, the lowest in three years.

He finishes by explaining:

That’s because the increase in power prices has been almost entirely offset by the high Australian dollar, which has produced tradeable goods deflation of 1.4% over the past year. In other words, thanks to the high Australian dollar we are getting a big improvement in energy infrastructure without an overall drop in living standards.

And thank goodness for fast rising power prices — without that, we’d have deflation. It’s true!

But it’s not true, and it’s not true for a very important reason.

Back in 1997, in the guts of of the Great Moderation (the time from the mid ’80s to the start of 2007 when US aggregate volatility was low) and before the real estate boom that presaged the financial crisis of 2007/2008, Paul Krugman famously wrote (this Economist piece is the best reference I could find in the two minutes I spent looking on Google) that unemployment was whatever Alan Greenspan wanted it to be, “plus or minus a random error reflecting the fact that he is not quite God.”

It’s popular to argue that Ben Bernanke lacks that power now that America has interest rates at zero. I disagree (see here and here), but I appreciate the argument.

Australia has no such problem. Interest rates are still strictly positive and the RBA has plenty of room to lower them if they wish.

So I have no qualms at all in saying that inflation in Australia is whatever Glenn Stevens (the governor of the RBA) wants it to be, plus or minus a random error to reflect the fact that he’s not quite God.

If the various state grids had all been upgraded a decade ago and electricity prices were currently stable, then interest rates would currently be lower too. They would be lower because that would ensure faster growth in general and a lower exchange rate, both of which would lead to higher inflation, thereby offsetting the lower inflation in electricity prices.

There’s a famous argument in economics called the Lucas Critique, named for the man that came up with it, that points out simply that if you change your policy, economic agents will change their actions in response.  It applies in reverse, too, though.  If economic agents change their actions, policy will change!

Alan Kohler ought to know this. Indeed, I suspect that Alan Kohler does know this, but it’s a slippery concept to keep at the front of your mind all the time and, besides, it would make it hard to write exciting opinion pieces. 🙂

Output gaps, inflation and totally awesome blogosphere debates

I love the blogosphere.  It lets all sorts of debates happen that just can’t happen face to face in the real world.  Here’s one that happened lately:

James Bullard, of the St. Louis Fed, gave a speech in which (I believe) he argued that wealth effects meant that potential output was discretely lower now after the crash of 2006-2008.  David Andolfato and Tyler Cowen both liked his argument.

Scott Sumner, Noah Smith, Paul Krugman, Matt Yglesias, Mark Thoma and Tim Duy (apologies if I missed anyone) all disagreed with it for largely the same reason:  A bubble is a price movement and prices don’t affect potential output, if for no other reason then because potential output is defined as the output that would occur if prices didn’t matter.

Brad DeLong also disagreed on the same grounds, but was willing to grant that a second-order effect through labour-force participation may be occurring, although that was not the argument that Bullard appeared to be making.

In response, Bullard wrote a letter to Tim Duy, in which he revised his argument slightly, saying that it’s not that potential output suddenly fell, but that it was never so high to start with.  We were overestimating potential output during the bubble period and are now estimating it more accurately.

The standard reply to this, as provided by by Scott SumnerTim DuyMark Thoma and Paul Krugman, takes the form of:  If actual output was above potential during the bubble, then where was the resulting inflation?  What is so wrong with the CBO’s estimate of potential output (which shows very little output gap during the bubble period)?

Putting to one side discussions of what the output gap really is and how to properly estimate it (see, for example, Menzie Chinn here, here and here), I’ve always felt a sympathy with the idea that Bullard is advocating here.  Although I do not have a formal model to back it up, here is how I’ve generally thought of it:

  • Positive output gaps (i.e. actual output above potential) do not directly cause final-good inflation.  Instead, they cause wage inflation, which raises firms’ marginal costs, which causes final-good inflation.
  • Globalisation in general, and the rise of China in particular, meant that there was — and remains — strong, competition-induced downward pressure on the price of internationally tradable goods.
  • That competition would induce domestic producers of tradable goods to either refuse wage increases or go out of business.
  • Labour is not (or at least is very poorly) substitutable.  Somebody trained as a mechanic cannot do the work of an accountant.
  • Therefore, the wages of workers in industries producing tradable goods stayed down, while the wages of workers in industries producing non-tradable goods were able to rise.
  • Indeed, we see in the data that both price and wage inflation in non-tradable industries have been consistently higher than those in tradable sectors over the last decade and, in some cases, very much higher.

The inflation was there.  It was just limited to a subset of industries … like the financial sector.

(Note that I’m implicitly assuming fixed, or at least sticky, exchange rates)

As it happens, I also — like Tyler Cowen — have a sneaking suspicion that temporary (nominal) demand shocks can indeed have effects that are observationally equivalent to (highly) persistent (real) supply shocks.  That’s a fairly controversial statement, but backing it up will have to wait for another post …

Is Paul Krugman nine times as interesting as sex?

My brother, who clearly has too much spare time on his hands, was yesterday browsing through my Archive page when he discovered that I have published 18 posts that refer to ‘Paul Krugman‘ in some way, but only two posts that refer to ‘sex‘.  This, he proposed, suggested either an unhealthy attachment to Professor Krugman, or a most disappointing detachment from fornication.

The present post brings the ratio from a lofty 9:1 down to only 6.3:1, but I fear it may still be too high!  Clearly a flood of pornographic material is called for …

US treasury interest rates and (disin|de)flation

This Bloomberg piece from a few days ago caught my eye.  Let me quote a few hefty chunks from the article (highlighting is mine):

Bond investors seeking top-rated securities face fewer alternatives to Treasuries, allowing President Barack Obama to sell unprecedented sums of debt at ever lower rates to finance a $1.47 trillion deficit.

While net issuance of Treasuries will rise by $1.2 trillion this year, the net supply of corporate bonds, mortgage-backed securities and debt tied to consumer loans may recede by $1.3 trillion, according to Jeffrey Rosenberg, a fixed-income strategist at Bank of America Merrill Lynch in New York.

Shrinking credit markets help explain why some Treasury yields are at record lows even after the amount of marketable government debt outstanding increased by 21 percent from a year earlier to $8.18 trillion. Last week, the U.S. government auctioned $34 billion of three-year notes at a yield of 0.844 percent, the lowest ever for that maturity.
[…]
Global demand for long-term U.S. financial assets rose in June from a month earlier as investors abroad bought Treasuries and agency debt and sold stocks, the Treasury Department reported today in Washington. Net buying of long-term equities, notes and bonds totaled $44.4 billion for the month, compared with net purchases of $35.3 billion in May. Foreign holdings of Treasuries rose to $33.3 billion.
[…]
A decline in issuance is expected in other sectors of the fixed-income market. Net issuance of asset-backed securities, after taking into account reinvested coupons, will decline by $684 billion this year, according to Bank of America’s Rosenberg. The supply of residential mortgage-backed securities issued by government-sponsored companies such as Fannie Mae and Freddie Mac is projected to be negative $320 billion, while the debt they sell directly will shrink by $164 billion. Investment- grade corporate bonds will decrease $132 billion.

“The constriction in supply is all about deleveraging,” Rosenberg said.
[…]
“There’s been a collapse in both consumer and business credit demand,” said James Kochan, the chief fixed-income strategist at Menomonee Falls, Wisconsin-based Wells Fargo Fund Management, which oversees $179 billion. “To see both categories so weak for such an extended period of time, you’d probably have to go back to the Depression.”

Greg Mankiw is clearly right to say:

“I am neither a supply-side economist nor a demand-side economist. I am a supply-and-demand economist.”

(although I’m not entirely sure about the ideas of Casey Mulligan that he endorses in that post — I do think that there are supply-side issues at work in the economy at large, but that doesn’t necessarily imply that they are the greater fraction of America’s macroeconomic problems, or that demand-side stimulus wouldn’t help even if they were).

When it comes to US treasuries, it’s clear that shifts in both demand and supply are at play.  Treasuries are just one of the investment-grade securities on the market that are, as a first approximation, close substitutes for each other.  While the supply of treasuries is increasing, the supply of investment-grade securities as a whole is shrinking (a sure sign that demand is falling in the broader economy) and the demand curve for those same securities is shifting out (if the quantity is rising and the price is going up and supply is shifting back, then demand must also be shifting out).

Paul Krugman and Brad DeLong have been going on for a while about invisible bond market vigilantes, criticising the critics of US fiscal stimulus by pointing out that if there were genuine fears in the market over government debt, then interest rates on the same (which move inversely to bond prices) should be rising, not falling as they have been.  Why the increased demand for treasuries if everyone’s meant to be so afraid of them?

They’re right, of course (as they so often are), but that’s not the whole picture.  In the narrowly-defined treasuries market, the increasing demand for US treasuries is driven not only by the increasing demand in the broader market for investment-grade securities, but also by the contraction of supply in the broader market.

It’s all, in slow motion, the very thing many people were predicting a couple of years ago — the gradual nationalisation of hither-to private debt.  Disinflation (or even deflation) is essentially occurring because the government is not replacing all of the contraction in private credit.

On interest rates

In what Tyler Cowen calls “Critically important stuff and two of the best recent economics blog posts, in some time,” Paul Krugman and Brad DeLong have got some interesting thoughts on US interest rates.  First Krugman:

On the face of it, there’s no reason to be worried about interest rates on US debt. Despite large deficits, the Federal government is able to borrow cheaply, at rates that are up from the early post-Lehman period … but well below the pre-crisis levels:

DESCRIPTION

Underlying these low rates is, in turn, the fact that overall borrowing by the nonfinancial sector hasn’t risen: the surge in government borrowing has in fact, less than offset a plunge in private borrowing.

So what’s the problem?

Well, what I hear is that officials don’t trust the demand for long-term government debt, because they see it as driven by a “carry trade”: financial players borrowing cheap money short-term, and using it to buy long-term bonds. They fear that the whole thing could evaporate if long-term rates start to rise, imposing capital losses on the people doing the carry trade; this could, they believe, drive rates way up, even though this possibility doesn’t seem to be priced in by the market.

What’s wrong with this picture?

First of all, what would things look like if the debt situation were perfectly OK? The answer, it seems to me, is that it would look just like what we’re seeing.

Bear in mind that the whole problem right now is that the private sector is hurting, it’s spooked, and it’s looking for safety. So it’s piling into “cash”, which really means short-term debt. (Treasury bill rates briefly went negative yesterday). Meanwhile, the public sector is sustaining demand with deficit spending, financed by long-term debt. So someone has to be bridging the gap between the short-term assets the public wants to hold and the long-term debt the government wants to issue; call it a carry trade if you like, but it’s a normal and necessary thing.

Now, you could and should be worried if this thing looked like a great bubble — if long-term rates looked unreasonably low given the fundamentals. But do they? Long rates fluctuated between 4.5 and 5 percent in the mid-2000s, when the economy was driven by an unsustainable housing boom. Now we face the prospect of a prolonged period of near-zero short-term rates — I don’t see any reason for the Fed funds rate to rise for at least a year, and probably two — which should mean substantially lower long rates even if you expect yields eventually to rise back to 2005 levels. And if we’re facing a Japanese-type lost decade, which seems all too possible, long rates are in fact still unreasonably high.

Still, what about the possibility of a squeeze, in which rising rates for whatever reason produce a vicious circle of collapsing balance sheets among the carry traders, higher rates, and so on? Well, we’ve seen enough of that sort of thing not to dismiss the possibility. But if it does happen, it’s a financial system problem — not a deficit problem. It would basically be saying not that the government is borrowing too much, but that the people conveying funds from savers, who want short-term assets, to the government, which borrows long, are undercapitalized.

And the remedy should be financial, not fiscal. Have the Fed buy more long-term debt; or let the government issue more short-term debt. Whatever you do, don’t undermine recovery by calling off jobs creation.

The point is that it’s crazy to let the rescue of the economy be held hostage to what is, if it’s an issue at all, a technical matter of maturity mismatch. And again, it’s not clear that it even is an issue. What the worriers seem to regard as a danger sign — that supposedly awful carry trade — is exactly what you would expect to see even if fiscal policy were on a perfectly sustainable trajectory.

Then DeLong:

I am not sure Paul is correct when he says that the possible underlying problem is merely “a technical matter of maturity mismatch.” The long Treasury market is thinner than many people think: it is not completely implausible to argue that it is giving us the wrong read on what market expectations really are because long Treasuries right now are held by (a) price-insensitive actors like the PBoC and (b) highly-leveraged risk lovers borrowing at close to zero and collecting coupons as they try to pick up nickles in front of the steamroller. And to the extent that the prices at which businesses can borrow are set by a market that keys off the Treasury market, an unwinding of this “carry trade”–if it really exists–could produce bizarre outcomes.

Bear in mind that this whole story requires that the demand curve slope the wrong way for a while–that if the prices for Treasury bonds fall carry traders lose their shirts and exit the market, and so a small fall in Treasury bond prices turns into a crash until someone else steps in to hold the stock…

For reference, here are the time paths of interest rates for a variety of term lengths and risk profiles (all taken from FRED):

interest_rates_1monthinterest_rates_3monthsinterest_rates_30years

To my own mind, I’m somewhat inclined to agree with Krugman.  While I do believe that the carry trade is occurring, I suspect that it’s effects are mostly elsewhere, or at least that the carry trade is not being played particularly heavily in long-dated US government debt relative to other asset markets.

Notice that the AAA and BAA 30-year corporate rates are basically back to pre-crisis levels and that the premium they pay over 30-year government debt is also back to typical levels.  If the long-dated rates are being pushed down to pre-crisis levels solely by increased supply thanks to the carry trade, then we would surely expect the quantity of credit to also be at pre-crisis levels.  But new credit issuance is down relative to the pre-crisis period.  Since the price is largely unchanged, that means that both demand and supply of credit have shrunk – the supply from fear in the financial market pushing money to the short end of the curve and the demand from the fact that there’s been a recession.

Just a smidgen more on US healthcare reform

My previous comment on US healthcare reform, which was actually a comment on the current Australian system, got quite a few eyeballs thanks to John Hempton’s shout-out.  Anyway, I thought I’d highlight a couple of new developments for my little audience.

First, Republican Senator Olympia Snowe (of Maine), who sits on the Senate Finance Committee, has said that she will vote in favour of the suggested bill being proposed by that committee’s chairman, Max Baucus.  That is good for the Democrats as it will provide valuable political cover.  It’s no guarantee that she will vote in favour of whatever the Senate as a whole end up producing, or for whatever the Senate and House then negotiate as the final bill, but it’s still a significant move and the probability of her voting for those later versions has just increased.

Second, we have the fact that the healthcare insurance industry has recently done an about-face, from actively promoting reform to actively fighting against it.  Nate Silver points out why:

Take a look at what’s happened to the share prices of the six largest publicly-traded health insurance companies since Labor Day, which was about the point at which the Democrats appeared to regain their footing — at least up to a point — on health care.

Weighted for market capitalization, these insurance stocks have lost 11 percent of their value since Labor Day, wiping out about $10 billion in value. And that’s understating the case since the major indices have gained 5-8 percent over the same period — the insurance industry stocks are underperforming the market by just shy of 20 percent.

So why have they tanked in the stock market?  Nate suggests two reasons:

Firstly, the individual mandate has been weakened to the point where it’s arguably a tokenish provision. There are good, policy reasons to be worried about this, although the insurance lobby’s reasons for being opposed — they’ll have less guarantee of an incoming phalanx of high-margin customers — are not necessarily the same as the public’s at large. The second factor is that the Baucus bill in certain ways treats the insurers fairly harshly, both taxing them directly as well as levying a surcharge on high-cost insurance plans.

I’d also suggest that the compromise version of the public option (that it be in the bill, but with states able to opt out if they wish [Paul Krugman, Talking Points Memo]) will have scared the insurance companies and investors as well.

In which I respectfully disagree with Paul Krugman

Paul Krugman [Ideas, Princeton, Unofficial archive] has recently started using the phrase “jobless recovery” to describe what appears to be the start of the economic recovery in the United States [10 Feb, 21 Aug, 22 Aug, 24 Aug].  The phrase is not new.  It was first used to describe the recovery following the 1990/1991 recession and then used extensively in describing the recovery from the 2001 recession.  In it’s simplest form, it is a description of an economic recovery that is not accompanied by strong jobs growth.  Following the 2001 recession, in particular, people kept losing jobs long after the economy as a whole had reached bottom and even when employment did bottom out, it was very slow to come back up again.  Professor Krugman (correctly) points out that this is a feature of both post-1990 recessions, while prior to that recessions and their subsequent recoveries were much more “V-shaped”.  He worries that it will also describe the recovery from the current recession.

While Professor Krugman’s characterisations of recent recessions are broadly correct, I am still inclined to disagree with him in predicting what will occur in the current recovery.  This is despite Brad DeLong’s excellent advice:

  1. Remember that Paul Krugman is right.
  2. If your analysis leads you to conclude that Paul Krugman is wrong, refer to rule #1.

This will be quite a long post, so settle in.  It’s quite graph-heavy, though, so it shouldn’t be too hard to read. 🙂

Professor Krugman used his 24 August post on his blog to illustrate his point.  I’m going to quote most of it in full, if for no other reason than because his diagrams are awesome:

First, here’s the standard business cycle picture:

DESCRIPTION

Real GDP wobbles up and down, but has an overall upward trend. “Potential output” is what the economy would produce at “full employment”, which is the maximum level consistent with stable inflation. Potential output trends steadily up. The “output gap” — the difference between actual GDP and potential — is what mainly determines the unemployment rate.

Basically, a recession is a period of falling GDP, an expansion a period of rising GDP (yes, there’s some flex in the rules, but that’s more or less what it amounts to.) But what does that say about jobs?

Traditionally, recessions were V-shaped, like this:

DESCRIPTION

So the end of the recession was also the point at which the output gap started falling rapidly, and therefore the point at which the unemployment rate began declining. Here’s the 1981-2 recession and aftermath:

DESCRIPTION

Since 1990, however, growth coming out of a slump has tended to be slow at first, insufficient to prevent a widening output gap and rising unemployment. Here’s a schematic picture:

DESCRIPTION

And here’s the aftermath of the 2001 recession:

DESCRIPTION

Notice that this is NOT just saying that unemployment is a lagging indicator. In 2001-2003 the job market continued to get worse for a year and a half after GDP turned up. The bad times could easily last longer this time.

Before I begin, I have a minor quibble about Prof. Krugman’s definition of “potential output.”  I think of potential output as what would occur with full employment and no structural frictions, while I would call full employment with structural frictions the “natural level of output.”  To me, potential output is a theoretical concept that will never be realised while natural output is the central bank’s target for actual GDP.  See this excellent post by Menzie Chinn.  This doesn’t really matter for my purposes, though.

In everything that follows, I use total hours worked per capita as my variable since that most closely represents the employment situation witnessed by the average household.  I only have data for the last seven US recessions (going back to 1964).  You can get the spreadsheet with all of my data here: US_Employment [Excel].  For all images below, you can click on them to get a bigger version.

The first real point I want to make is that it is entirely normal for employment to start falling before the official start and to continue falling after the official end of recessions.  Although Prof. Krugman is correct to point out that it continued for longer following the 1990/91 and 2001 recessions, in five of the last six recessions (not counting the current one) employment continued to fall after the NBER-determined trough.  As you can see in the following, it is also the case that six times out of seven, employment started falling before the NBER-determined peak, too.

Hours per capita fell before and after recessions

Prof. Krugman is also correct to point out that the recovery in employment following the 1990/91 and 2001 recessions was quite slow, but it is important to appreciate that this followed a remarkably slow decline during the downturn.  The following graph centres each recession around it’s actual trough in hours worked per capita and shows changes relative to those troughs:

Hours per capita relative to and centred around trough

The recoveries following the 1990/91 and 2001 recessions were indeed the slowest of the last six, but they were also the slowest coming down in the first place.  Notice that in comparison, the current downturn has been particularly rapid.

We can go further:  the speed with which hours per capita fell during the downturn is an excellent predictor of how rapidly they rise during the recovery.  Here is a scatter plot that takes points in time chosen symmetrically about each trough (e.g. 3 months before and 3 months after) to compare how far hours per capita fell over that time coming down and how far it had climbed on the way back up:

ComparingRecessions_20090605_Symmetry_Scatter_All

Notice that for five of the last six recoveries, there is quite a tight line describing the speed of recovery as a direct linear function of the speed of the initial decline.  The recovery following the 1981/82 recession was unusually rapid relative to the speed of it’s initial decline.  Remember (go back up and look) that Prof. Krugman used the 1981/82 recession and subsequent recovery to illustrate the classic “V-shaped” recession.  It turns out to have been an unfortunate choice since that recovery was abnormally rapid even for pre-1990 downturns.

Excluding the 1981/82 recession on the basis that it’s recovery seems to have been driven by a separate process, we get quite a good fit for a simple linear regression:

ComparingRecessions_20090605_Symmetry_Scatter_Excl_81-82

Now, I’m the first to admit that this is a very rough-and-ready analysis.  In particular, I’ve not allowed for any autoregressive component to employment growth during the recovery.  Nevertheless, it is quite strongly suggestive.

Given the speed of the decline that we have seen in the current recession, this points us towards quite a rapid recovery in hours worked per capita (although note that the above suggests that all recoveries are slower than the preceding declines – if they were equal, the fitted line would be at 45% (the coefficient would be one)).

How to value toxic assets (part 2)

Continuing on from my previous post on this topic, Paul Krugman has been voicing similar concerns (and far more eloquently).  Although his focus has been on the idea of a bad bank (to which all the regular banks would sell their CDOs and other now-questionable assets), the problems are the same.  On the 17th of January he wrote:

It comes back to the original questions about the TARP. Financial institutions that want to “get bad assets off their balance sheets” can do that any time they like, by writing those assets down to zero — or by selling them at whatever price they can. If we create a new institution to take over those assets, the $700 billion question is, at what price? And I still haven’t seen anything that explains how the price will be determined.

I suspect, though I’m not certain, that policymakers are once more coming around to the view that mortgage-backed securities are being systematically underpriced. But do we really know this? And how are we going to ensure that this doesn’t end up being a huge giveaway to financial firms?

On the 18th of January, he followed this up with:

What people are thinking about, it’s pretty clear, is the Resolution Trust Corporation, which cleaned up the savings and loan mess. That’s a good role model, as far as it goes. But the creation of the RTC did not rescue the S&Ls. The S&Ls were rescued by (1) having FSLIC seize them, cleaning out the stockholders (2) having FSLIC pay down enough debt to make them viable (3) reselling them to new investors. The RTC’s takeover of the bad assets was just a way for taxpayers to reclaim some of the cost of recapitalizing the banks.

What’s being contemplated now, if Sheila Bair’s interview is any indication, is the creation of an RTC-like entity without the rest of the process. The “bad bank” will pay “fair value”, whatever that is, for the assets. But how does that help the situation?

It looks as if we’re back to the idea that toxic waste is really, truly worth much more than anyone is willing to pay for it — and that if only we get the price “right”, the banks will turn out to be solvent after all. In other words, we’re still in Super-SIV territory, the belief that fancy financial engineering can create value out of nothing.

Tyler Cowen points us to this article in the Washington Post that describes the issues pretty well.  Again, the crux of the matter is:

The difficulty is that banks think their assets are worth more than investors are willing to pay. If the government sides with investors, the banks will be forced to swallow the difference as a loss. If the government pays what the banks regard as a fair price, however, the markets may ignore the transactions as a bailout by another name.

Tyler Cowen’s own comment:

If the assets are undervalued by the market, buying them up is an OK deal. Presumably the price would be determined by a reverse auction, with hard-to-track asset heterogeneity introducing some arbitrariness into the resulting prices. If these assets are not undervalued by the market, and indeed they really are worth so little, our government wishes to find a not-fully-transparent way to give financial firms greater value, also known as “huge giveaway.”

Right now it seems to boil down to the original TARP idea or nationalization, take your pick. You are more likely to favor nationalization if you think that governments can run things well, if you feel there is justice in government having “upside” on the deal, and if you are keen to spend the TARP money on other programs instead.