Continuing on my theme of predicting that the winner among the pledged delegates will win the Democratic Party’s nomination because the super delegates will (probably) flock to the leader among pledged delegates in order to build the appearance of unanimity and avoid a floor fight at the convention (see here and here), I’ve updated my table. I’m now using the data from Real Clear Politics for no particular reason beyond ease of extraction.
| Date | Barack Obama: running total | Barack Obama: share of pledged delegates | Hillary Clinton: running total |
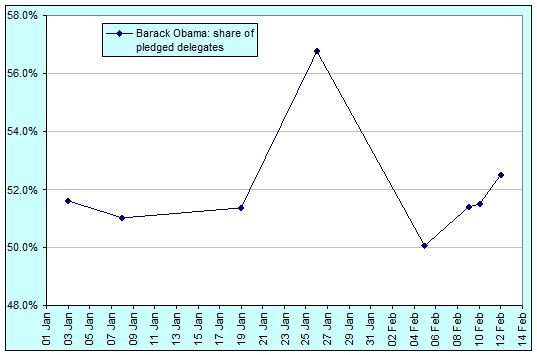
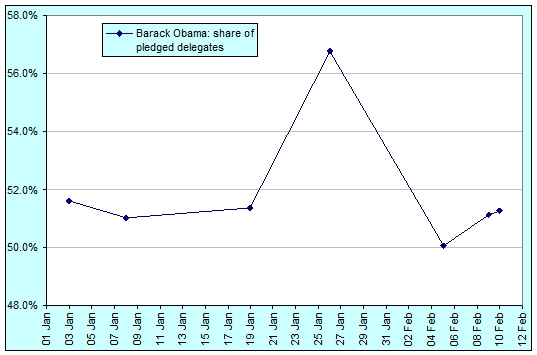
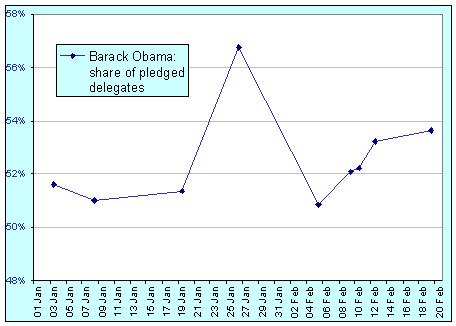
| 3 Jan (IA) | 16 | 51.6% | 15 |
| 8 Jan (NH) | 25 | 51.0% | 24 |
| 19 Jan (NV) | 38 | 51.4% | 36 |
| 26 Jan (SC) | 63 | 56.8% | 48 |
| 5 Feb (Super Tuesday) | 906 | 50.8% | 876 |
| 9 Feb (LA, NE, WA, Virgin Is.) | 1012 | 52.1% | 931 |
| 10 Feb (ME) | 1027 | 52.2% | 940 |
| 12 Feb (DC, MD, VA) | 1134 | 53.2% | 996 |
| 19 Feb (HI, WI) | 1185 | 53.6% | 1024 |
The RCP data still include estimates and don’t include 56 delegates that have nominally already been allocated (26 are with Edwards, 30 RCP aren’t willing to estimate one way or the other, but since 10 of those 30 are in Hawaii, it seems safe to say that they’ll break for Obama overall). For the sake of simplicity, let’s assume that the 56 break down as 30 to Obama and 26 to Clinton (that’s 53.5% of them to Obama). That gives us 1215 for Obama and 1050 to Clinton to-date.
There are 988 pledged delegates to go (giving 3253 in total). To win the pledged delegates race, a candidate needs 1627. That means that Obama only needs 412, or 41.7%, of the remaining 988 to-be-pledged delegates. Clinton needs 577, or 58.4%, of the remainder.
As an indication of how tough that will be, Clinton’s best vote performance so far was 57% in New York. She has only managed to break 55% of delegates pledged in 9 out of 37 primaries/caucuses so far and that’s including American Samoa that only had three delegates to give. If she is going to do it, her wins in Texas (193 to-be-pledged delegates) and Ohio (141) will need to be huge. I just can’t see it happening.
The polls do have Clinton up with 50.2% vs. 42.6% in Texas and 52.7% vs. 38.0% in Ohio on average. That’s a pretty big undecided gap, but I can’t see it all breaking for Clinton given the apparent movement towards Obama in the more recent polls. By comparison, the betting markets at InTrade put Obama at a 68% chance of winning in Texas and a 49% chance of winning in Ohio. I suspect that the betting market is a little overly pro-Obama, just as it was in the lead-up to New Hampshire, but just like in New Hampshire, I think that although Hillary Clinton will win the headline vote, she’ll barely win in the delegates pledged.
So, my prediction: Come the 5th of March, Obama will still be ahead in pledged delegates and will probably still be ahead after adding in the ridiculously apportioned super-delegates by the Main Stream Media estimates. Look for it to be all over bar the shouting in two weeks.