During the recent US presidential election, California voted to change it’s state constitution to exclude gay couples from being married (proposition 8). Prior to the election, the Californian supreme court had overturned a regular law that banned gay marriage as being unconstitutional. Thus the (successful) move by social conservatives to change the state’s constitution.
Via Andrew Sullivan (1, 2, 3, 4) and in a demonstration of the move towards David Brin’s “Transparent Society,” I give you http://www.eightmaps.com where you can see the names, addresses, employer and amount donated of everybody that gave money to the proposition 8 campaign, all arranged on a Google Maps mash-up.
Brad Setser (there are lots of pretty graphs on his site):
There is only one way to square a record trade surplus with the sharp fall in reserve growth:
Hot money is now flowing out of China. Here is one way of thinking of it:
The trade surplus should have produced a $115 billion increase in China’s foreign assets. FDI inflows and interest income should combine to produce another $30-40 billion. The fall in the reserve requirement should have added another $50-55 billion (if not more) to China’s reserves. Sum it up and China’s reserves would have increased by about $200 billion in the absence of hot money flows. Instead they went up by about $50 billion. That implies that money is now flowing out of China as fast as it flowed in during the first part of 2008.
And in December, the outflows were absolutely brutal. December reserves were up by $20 billion or so after accounting for valuation changes – but the fall in the reserve requirement alone should have pushed reserves up by at least $25 billion. Throw in a close to $40 billion trade surplus and another $10 billion or so from FDI and interest income, and the small increases in reserves implies $70 billion plus in monthly hot only outflows … That’s huge. Annualized, it is well in excess of 10% of China’s GDP. Probably above 15%.
The mystery being, of course, who is doing the “hot money” transfers. Chinese companies? Investors from Taiwan or Hong Kong? Investors from further abroad? Brad seems to suspect the second:
Over time, if hot money outflows subside, China’s reserve growth should converge to its current account surplus (plus net FDI inflows). That implies ongoing Treasury purchases – though not at the current pace – barring a shift back into “risk” assets. And if hot money outflows continue, watch for Hong Kong and Taiwan to buy more Treasuries. The money flowing out of China doesn’t just disappear … it has to go somewhere.
Important: Much of this post is mistaken (i.e. wrong). It’s perfectly possible for America to have an M1 money multiplier of less than one even if they were an entirely closed economy. My apologies. I guess that’s what I get for clicking on “Publish” at one in the morning. A more sensible post should be forthcoming soon. I’m leaving this here, with all its mistakes, for the sake of completeness and so that people can compare it to my proper post whenever I get around to it.
Update: You can (finally) see the improved post here. You’ll probably still want to refer back to this one for the graphs.
At the time of writing, the latest figure (for 17 December 2008) was 0.954. That’s fascinating, because it should be impossible. As far as I can tell, it has been made possible by the wonders of financial globalisation and was triggered by a decision the US Federal Reserve made at the start of October 2008. More importantly, it means that America is paying to recapitalise some banks in other countries and while that will help them in the long run, it might be exacerbating the recessions in those countries in the short run.
Money is a strange thing. One might think it would be easy to define (and hence, to count), but there is substantial disagreement of what qualifies as money and every central bank has their own set of definitions. In America the definitions are (loosely):
M0 (the monetary base) = Physical currency in circulation + reserves held at the Federal Reserve
M1 = Physical currency in circulation + deposit (e.g. checking) accounts at regular banks
M2 = M1 + savings accounts
They aren’t entirely correct (e.g. M1 also includes travelers cheques, M2 also includes time/term deposits, etc.), but they’ll do for the moment [you can see a variety of countries’ definitions on Wikipedia].
The M1 Money Multiplier is the ratio of M1 to M0. That is, M1 / M0.
In the normal course of events, regular banks’ reserves at the central bank are only a small fraction of the deposits they hold. The reason is simple: The central bank doesn’t pay interest on reserves, so they’d much rather invest (i.e. lend) the money elsewhere. As a result, they only keep in reserve the minimum that they’re required to by law.
We therefore often think of M1 as being defined as: M1 = M0 + deposits not held in reserve.
You can hopefully see why it should seem impossible for the M1 money multiplier to fall below 1. M1 / M0 = (M0 + non-reserve deposits) / M0 = 1 + (non-reserve deposits / M0). Since the non-reserve deposits are always positive, the ratio should always be greater than one. So why isn’t it?
Step 1 in understanding why is this press release from the Federal Reserve dated 6 October 2008. Effective from 1 October 2008, the Fed started paying interest on both required and excess reserves that regular banks (what the Fed calls “depository institutions”) held with it. The interest payments for required reserves do not matter here, since banks had to keep that money with the Fed anyway. But by also paying interest on excess reserves, the Fed put a floor under the rate of return that banks demanded from their regular investments (i.e. loans).
The interest rate paid on excess returns has been altered a number of times (see the press releases on 22 Oct, 5 Nov and 16 Dec), but the key point is this: Suppose that the Fed will pay x% on excess reserves. That is a risk-free x% available to banks if they want it, while normal investments all involve some degree of risk. US depository institutions suddenly had a direct incentive to back out of any investment that had a risk-adjusted rate of return less than x% and to put the money into reserve instead, and boy did they jump at the chance. Excess reserves have leapt tremendously:
Excess Reserves of Depository Institutions (USA, Accessed: 7 Jan 2009)
Adjusted Monetary Base (USA, Accessed: 7 Jan 2009)
If we think of M1 as being M1 = M0 + non-reserve deposits, then we would have expected M1 to increase by similar amounts (a little under US$800 billion). In reality, it’s only risen by US$200 billion or so:
M1 Money Stock (USA, Accessed: 7 Jan 2009)
So where have the other US$600 billion come from? Other countries.
Remember that the real definition of M1 is M1 = Physical currency in circulation + deposit accounts. The Federal Reserve, when calculating M1, only looks at deposits in America.
By contrast, the definition of the monetary base is M0 = Physical currency in circulation + reserves held at Federal Reserve. The Fed knows that those reserves came from American depository institutions, but it has no idea where they got it from.
Consider Citibank. It collects deposits from all over the world, but for simplicity, imagine that it only collects them in America and Britain. Citibank-UK will naturally keep a fraction of British deposits in reserve with the Bank of England (the British central bank), but it is free to invest the remainder wherever it likes, including overseas. Since it also has an arm in America that is registered as a depository institution, putting that money in reserve at the Federal Reserve is an option.
That means that, once again, if Citibank-UK can’t get a risk-adjusted rate of return in Britain that is greater than the interest rate the Fed is paying on excess reserves, it will exchange the British pounds for US dollars and put the money in reserve at the Fed. The only difference is that the risk will now involve the possibility of exchange-rate fluctuations.
It’s not just US-based banks with a presence in other countries, though. Any non-American bank that has a branch registered as a depository institution in America (e.g. the British banking giant, HSBC) has the option of changing their money into US dollars and putting them in reserve at the Fed.
So what does all of that mean? I see two implications:
Large non-American banks that have American subsidiaries are enjoying the free money that the Federal Reserve is handing out. By contrast, smaller non-American banks that do not have American subsidiaries are not able to access the Federal Reserve system and so are forced to find other investments.
The US$600+ billion of foreign money currently parked in reserve at the Fed had to come out of the countries of origin, meaning that it is no longer there to stimulate their economies. By starting to pay interest on excess reserves, the US Federal Reserve effectively imposed an interest rate increase on other countries.
In the USA, the CBO has just released a microscopically-detailed breakdown on how federal taxes are paid for by household for the years 1979 through to 2005 inclusive. Everything is provided by quintile, with the top 20% being broken down into percentiles 81-90, 91-95, 95-99, 99.0-99.5, 99.5-99.9, 99.9-99.99 and the top 0.01%.
It includes, for each of those groups:
Effective Federal Tax Rates (Total Tax, Individual Income Tax, Social Insurance Tax, Corporate Income Tax and Excise Tax);
The share of federal government revenue for each of those;
With forecasts for annualised U.S. real GDP growth in 2008:Q4 as low as -6% (!) and seriously smart people worrying about next year, both from the left and the right, you really do have to wonder how ugly it’s going to get. Looking at the world as a whole is a recipe for staying under the covers tomorrow morning, too.
Stiglitz’s piece makes, to me, a compelling argument for letting the firms go into Chapter 11 bankruptcy, albeit (given the state of the market) with government guarantees for any further financing they may need for restructuring. The following four paragraphs are among the most succinct and clearly written on the US car industry:
Wall Street’s focus on quarterly returns encouraged the short-sighted behaviour that contributed to their own demise and that of America’s manufacturing, including the automotive industry. Today, they are asking to escape accountability. We should not allow it.
[…]
The US car industry will not be shut down, but it does need to be restructured. That is what Chapter 11 of America’s bankruptcy code is supposed to do. A variant of pre-packaged bankruptcy – where all the terms are set before going before the bankruptcy court – can allow them to produce better and more environmentally sound cars. It can also address legacy retiree obligations. The companies may need additional finance. Given the state of financial markets, the US government may have to provide that at terms that give the taxpayers a full return to compensate them for the risk. Government guarantees can provide assurances, as they did two decades ago when Chrysler faced its crisis.
With financial restructuring, the real assets do not disappear. Equity investors (who failed to fulfil their responsibility of oversight) lose everything; bondholders get converted into equity owners and may lose substantial amounts. Freed of the obligation to pay interest, the carmakers will be in a better position. Taxpayer dollars will go far further. Moral hazard – the undermining of incentives – will be averted: a strong message will be sent.
Some will talk of the pension funds and others that will suffer. Yes, but that is true of every investment that has diminished. The government may need to help some pension funds but it is better to do so directly, than via massive bail-outs hoping that a little of the money trickles down to the “widows and orphans”.
I would perhaps suppliment Professor Stiglitz’s words by proposing that government support to workers laid-off as part of the restructuring could be improved dramatically over the provisions currently available. They should not only include lengthening the duration of unemployment payments and paying for retraining programmes, but also payments to help with relocation if anybody is willing to (voluntarily!) move to find work. An Obama administration might also be reasonably expected to look to Michigan for skilled manual labour in it’s push for infrastructure renewal/expansion.
Yglesis’ brief note observes a vital co-ordination problem when it comes to restructuring what is genuinely a global industry:
One thing here is that as best I can tell none of the five countries — US, Japan, Germany, France, Korea — with substantial auto industries are willing to let their national favorites fail. And yet there seems to be substantial global overcapacity in car manufacturing. If a few of the existing firms are allowed to fail, then the survivors will be in good shape. But if nobody fails, then all the firms worldwide will be left suffering because of overcapacity problems, all potentially drawing bailouts and subsidies indefinitely.
Finally, Cringely’s piece investigates how a successful US car firm ought to be run by imagining that Steve Jobs (of Apple) was running it. The idea is not his. Thomas Friedman briefly mentioned in early November that …
… somebody ought to call Steve Jobs, who doesn’t need to be bribed to do innovation, and ask him if he’d like to do national service and run a car company for a year. I’d bet it wouldn’t take him much longer than that to come up with the G.M. iCar.
It was something of a trite comment, and it was picked up by many people in the IT industry who got a little over-excited when imagining the details of what functionality the iCar should have (for example). In contrast, Cringely looked at the most important thing that somebody trying to emulate Apple might bring to the car industry: it’s design and manufacturing process:
… embracing these [new technologies] requires the companies do something else that Jobs came to embrace with Apple’s products – stop building most of their own cars.
There are two aspects to this possible outsourcing issue. First is the whole concept of car companies as manufacturing their own products. There is plenty of outsourcing of car components. Most companies don’t make their own brakes, for example. Yamaha makes whole engines for Ford. Entire model lines are bought and rebadged from one maker to another. But nobody does it for everything, yet that’s what Steve Jobs would do.
All the U.S. car companies are closing plants, for example, and all are doing so because of overcapacity. But what would happen if just one of those companies — say Chrysler — decided that two years from now it would no longer actually assemble ANY of its own vehicles? Instead they’d put out an RFQ to every company in the world for 300,000 Chrysler Town & Country minivans as an example. Now THAT would be a dramatic move.
And a good one, frankly, because with a single pen stroke most of the overcapacity would be removed from the U.S. car market. Chrysler would have to shut down all those plants and lay off all those people, true, but doing it all the way all at once would change the nature of the company’s labor agreements such that there wouldn’t be a whimper. When you are eliminating 8 percent of capacity the tussle is over WHICH 8 percent. When you are eliminating ALL capacity, there is no tussle.
So Chrysler reaches out to contract manufacturers in this scenario and you know those manufacturers would fight for the work and probably give Chrysler a heck of a deal. For current models, for example, Chrysler could probably sell the tooling and maybe even the entire assembly plant for a lot more than they’d get from the real estate alone. But that particular advantage, I’d say, would be unique to the first big player to throw in the production towel.
In this scenario, Chrysler becomes a design, marketing, sales, and service organization. What’s wrong with that? They can change products more often and more completely because of their dramatically lower investment in production capital. They can pit their various suppliers against each other more effectively than could a surviving car manufacturer. It’s what Steve would do.
Everybody’s wringing their hands over the fact that the US economy suffered a net loss of 533,000 jobs in November. That’s an awful lot and it’s gotta hurt. Most media outlets are also observing that it’s the worst month for employment since 1974. Here is the Wall Street Journal:
The U.S. lost half a million jobs in November, the largest one-month drop since 1974, as employers brace for a recession that’s expected to stretch through much of 2009.
The nation’s employers cut 533,000 jobs in November, the Bureau of Labor Statistics reported Friday.
Not since December 1974, toward the end of a severe recession, have so many jobs disappeared in a single month — and the current recession, far from ending, appears to be just gathering steam.
These facts are true, but they’re also misleading. There are two important things that nobody that I can see is mentioning:
Firstly, the population of the USA has grown by over 43% in the last 34 years. In 1974 the resident population was 213 million. Today it is 306 million [source]. Losing half a million jobs in 1974 was a much bigger event than it is today.
Secondly, a much greater share of households only had one source of income in 1974 compared to today. Back then, if the sole worker lost their job, the family was in serious trouble. Today, if one of the (more often than not) two workers in a household loses their job, the family still suffers but far less than they would have back then.
Both of those will be cold comfort to anyone losing their job, but when watching events at a macroscopic level – looking at the country as a whole – it’s important to keep some perspective.
As a side note: The entry of women into the workforce will have served to reduce at least the scale, if not the likelihood, of a catostrophic loss of income to a household in the sense of Carroll (QJE 1997) (the paper is downloadable here). What work has been done investigating the links between female participation rates (or, more generally, the number of workers per household) and the extent of buffer-stock saving?
Update:
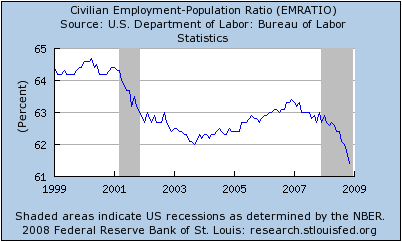
Paul Krugman looks at the ratio of employed people to total population:
Calculated Risk looks at the Year-over-Year percentage change in employment.
You’ll note, though, that they are both bloggers and not mainstream media.
The National Bureau of Economic Research (NBER), the official business-cycle dating body for the U.S., has declared that the United States is in a recession and that it started in December 2007.
The data were a little confusing in calling the timing. Gross Domestic Product (GDP) and Gross Domestic Income (GDI) are two sides of the same coin. Figures regarding their levels and growth rates ought to be the same and differ only because of statistical (i.e. counting) errors. From the formal release:
The committee believes that the two most reliable comprehensive estimates of aggregate domestic production are normally the quarterly estimate of real Gross Domestic Product and the quarterly estimate of real Gross Domestic Income, both produced by the Bureau of Economic Analysis. In concept, the two should be the same, because sales of products generate income for producers and workers equal to the value of the sales. However, because the measurement on the product and income sides proceeds somewhat independently, the two actual measures differ by a statistical discrepancy. The product-side estimates fell slightly in 2007Q4, rose slightly in 2008Q1, rose again in 2008Q2, and fell slightly in 2008Q3. The income-side estimates reached their peak in 2007Q3, fell slightly in 2007Q4 and 2008Q1, rose slightly in 2008Q2 to a level below its peak in 2007Q3, and fell again in 2008Q3. Thus, the currently available estimates of quarterly aggregate real domestic production do not speak clearly about the date of a peak in activity.
The brief respite in the middle of 2008 appears to be the result of the first fiscal stimulus package. Nevertheless, it seems quite clear that the overall trend has been downward.
The committee declared December 2007 as the peak after looking at payroll (i.e. employment) data:
Payroll employment, the number of filled jobs in the economy based on the Bureau of Labor Statistics’ large survey of employers, reached a peak in December 2007 and has declined in every month since then. An alternative measure of employment, measured by the BLS’s household survey, reached a peak in November 2007, declined early in 2008, expanded temporarily in April to a level below its November 2007 peak, and has declined in every month since April 2008.
… and personal income (less transfer payments):
Our measure of real personal income less transfers peaked in December 2007, displayed a zig-zag pattern from then until June 2008 at levels slightly below the December 2007 peak, and has generally declined since June.
… and real manufacturing and wholesale-retail trade sales:
Real manufacturing and wholesale-retail trade sales reached a well-defined peak in June 2008.
… and the Federal Reserve Board’s index of industrial production:
This measure has quite restricted coverage—it includes manufacturing, mining, and utilities but excludes all services and government. Industrial production peaked in January 2008, fell through May 2008, rose slightly in June and July, and then fell substantially from July to September. It rose somewhat in October with the resumption of oil production disturbed by hurricanes in the previous month. The October value of the industrial production index remained a substantial 4.7 percent below its value in January 2008.
The only really interesting thing in all of this to me is to observe that the first fiscal stimulus and the corresponding positive growth in 2008:Q2 saved some embarrassment for the Republican Party. The negative 2008:Q3 figures were only released on the 25th of November, three weeks after the U.S. election. Had the 2008:Q2 figures been even faintly negative, there may have been considerable (and, I think, reasonable) pressure for the recession to have been formally recognised in the middle of the campaign.
This is exactly the kind of detailed political question I don’t follow so let’s try some crude, fact-poor economism. Hillary Clinton commands the loyalties of significant segments of the Democratic Party. The implication is that Obama will need these segments for what he is trying to do. Since Obama already has 58 (?) Democratic Senators on his side, we should conclude that Obama will try to do lots in the first few months of his term; this is the “throw long and deep” scenario.
He can always encourage her to leave later, if the relationship does not work out. Latinos, on the other hand, are stronger as voters than as a lobby or as an organized segment of the Democratic Party. The implication is that they will get relatively little at the beginning of Obama’s term — when lobbies are needed — but successively more as the next election approaches.
Earlier this year, it seemed a good idea to plonk her on the ticket to defang the threat. That would have followed the “team of rivals” concept that Obama wanted to purloin from Lincoln. It would also have given the Clintons an independent claim on power. By winning without them and even, in some measure, despite them, Obama can now bring the Clintons into the power structure while retaining clear dominance. The State Department appointment is prestigious enough not to be condescending, yet also keeps Clinton off the Washington circuit more than any other position. She’ll be on a plane or abroad a great deal. Extra bonus: Bill will just love that. Sending his wife to the Middle East is the ex-president’s idea of a good time.
There’s also the small question of Iraq. Think of the appointment this way: “You voted for this bloody war, Hillary; you can end it.”
Withdrawing from Iraq will not be easy and it may well be gruesome. I have no confidence that the place won’t erupt into an even nastier civil war when the United States pulls out than it did when the United States didn’t fully push in. How does a president avoid the domestic blow-back of essentially cutting his losses on a doomed adventure? He uses Clinton as a protective shield from domestic critics. It’s also a rather brilliant manoeuvre against those elements on the right – from Fox News to Washington neocons – who came out in praise of Clinton in the spring when she sounded more hawkish than Obama on the Middle East. Having hailed Clinton as the Iron Lady of the Jews, the stab-in-the-back right will find it hard to pivot immediately and accuse her of treason if and when she ends the Iraq occupation.
But why did Hillary accept the job?
The best I can imagine off the top of my head is that (a) she really believes that the Obama presidency will be a successful one; and (b) a successful stint as Secretary of State after time in the Senate would look very, very good on the resume in eight years time.
Well, what do you know? The US government is (almost certainly) going to buy troubled assets after all, starting with those of Citigroup. CalculatedRisk has been on top of it [1,2,3,4]. The last of those links contains the joint statement by the Treasury, Federal Reserve and FDIC:
As part of the agreement, Treasury and the Federal Deposit Insurance Corporation will provide protection against the possibility of unusually large losses on an asset pool of approximately $306 billion of loans and securities backed by residential and commercial real estate and other such assets, which will remain on Citigroup’s balance sheet. As a fee for this arrangement, Citigroup will issue preferred shares to the Treasury and FDIC. In addition and if necessary, the Federal Reserve stands ready to backstop residual risk in the asset pool through a non-recourse loan.
In addition, Treasury will invest $20 billion in Citigroup from the Troubled Asset Relief Program in exchange for preferred stock with an 8% dividend to the Treasury. Citigroup will comply with enhanced executive compensation restrictions and implement the FDIC’s mortgage modification program.
Here is a summary of the terms of the deal, with a fraction more detail:
Size: Up to $306 bn in assets to be guaranteed (based on valuation agreed upon between institution and USG).
Deductible: Institution absorbs all losses in portfolio up to $29 bn (in addition to existing reserves) Any losses in portfolio in excess of that amount are shared USG (90%) and institution (10%).
USG share will be allocated as follows:
UST (via TARP) second loss up to $5 bn;
FDIC takes the third loss up to $10 bn;
Financing: Federal Reserve funds remaining pool of assets with a non-recourse loan, subject to the institution’s 10% loss sharing, at a floating rate of OIS plus 300bp. Interest payments are with recourse to the institution.
A couple of points:
The US government isn’t immediately buying US$306 billion of crappy assets. It’s guaranteeing that the value of them won’t fall too much further. If they do, then they’ll buy ’em. It will be interesting to see how much of this guarantee is actually called into force.
Notice that only US$20 billion is attributable to TARP, while the rest is entirely new. That is presumably to make sure that the US government can continue to stand by it’s recent promise to not ask for congressional approval for the last US$350 billion available under that program. On the other hand, I suppose it’s also likely that they want to keep the TARP money for direct capital infusions; that is, for actual money spent now rather than taking on risk.
To put the US$20 billion of new money into perspective, Citigroup’s market capitalisation as of Friday was US$20.5 billion.
It’s that “on valuation agreed upon between institution and USG” that troubles me. Part of the reasoning given for TARP in the first place was for “price discovery” (through reverse auctions). There was plenty of criticism of that policy, but the goal of discovering the true value of all of these assets is a noble one. This bailout of Citi will now involve private negotiation between Citigroup and the US government to determine their value for the purposes of the guarantee. That’s a bloody awful way to do it.