An information-based approach to understanding why America let Lehman Brothers collapse but saved everyone afterwards

In addition to his previous comments on the bailouts [25 Aug27 Aug28 Aug], which I highlighted here, Tyler Cowen has added a fourth post [2 Sep]:

I side with Bernanke because an economy can withstand only so much major bank insolvency at once. Lots of major banks were levered up 30-1 or so. Their assets fell in value more than a modest amount and then they were insolvent, sometimes grossly so. (A three percent decline in asset values already puts you into insolvency range.) If AIG had gone into bankruptcy court, some major banks would have been even more insolvent. Or if Frannie securities had been allowed to find their non-bailout values. My guess is that at least 15 out of the top 20 U.S. banks would have been flat-out insolvent if, starting at the time of Bear Stearns, all we had done was loose monetary policy and no other bailouts. Subsequent contagion effects, and the shut down of short-term repo markets, and a run on money market funds, would have made even more financial institutions insolvent. The world as we know it then becomes very dire, both for credit reasons and deflation reasons (yes you can print up currency to keep measured M up and running but the economy still collapses). So we needed not just emergency lending but also resource transfers to banks, basically to put them back into the range of possible solvency.

I really like to see Tyler’s evolving attitudes here.  It lets me know that mere grad students are allowed to not be sure of themselves. 🙂  In any event, let me present my latest thoughts on the bailouts:

Imagine being Bernanke/Paulson two days before Lehman Brothers went down:  you know they’re going to go down if you don’t bail them out and you know that to bail them out creates moral hazard problems (i.e. increases the likelihood of a repeat of the entire mess in another 10 years).  You don’t know how close to the edge everyone else is, nor how large an effect a Lehman collapse will have on everyone else in the short-run (thanks, in no small part, to the fact that all those derivatives were sold over-the-counter), but you’re nevertheless almost certain that Lehman Brothers are not important enough to take down the whole planet.

In that situation, I think of the decision to let Lehman Brothers go down as an experiment to allow estimation of the system’s interconnectedness.  Suppose you’ve got a structural model of the U.S. financial system as a whole, but no empirical basis for calibrating it.  Normally you might estimate the deep parameters from micro models, but when derivatives were exempted from regulation in the 2000 Commodities Futures Modernization Act, in addition to letting firms do what they wanted with derivatives you also gave up having information about what they were doing.  So instead, what you need is a macro shock that you can fully identify so that at least you can pull out the reduced-form parameters.  Letting Lehman go was the perfect opportunity for that shock.

I’m not saying that Bernanke had an actual model that he wanted to calibrate (although if he didn’t, I really hope he has one now), but he will certainly have had a mental model.  I don’t even mean to suggest that this was the reasoning behind letting Lehman go.  That would be one hell of a (semi) natural experiment and a pretty reckless way to gather the information.  Nevertheless, the information gained is tremendously valuable, both in itself and to society as a whole because it is now, at least in part, public information.

To some extent, I feel like the ideal overall response to the crisis from the Fed and Treasury would have been to let everyone fail a little bit, but that isn’t possible — you can’t let an institution become a little bit bankrupt in the same way that you can’t be just a little bit pregnant.  To me, the best real-world alternative was to let one or two institutions die to put the frighteners on everyone and discover the degree of interconnectedness of the system and then save the rest, with the nature and scale of the subsequent bailouts being determined by the reaction to the first couple going down.  I would only really throw criticism at the manner of the saving of the rest (especially the secrecy) and even then I would be hesitant because:

(a) it was all terribly political and at that point the last thing Bernanke needed was a financially-illiterate representative pushing his or her reelection-centred agenda every step of the way (we don’t let people into a hospital emergency room when the doctor isn’t yet sure of what’s wrong with the patient);

(b) perhaps the calibration afforded by the collapse of Lehman Brothers convinced Bernanke-the-physician that short-term secrecy was necessay to “stop the bleeding” (although that doesn’t necessarily imply that long-term secrecy is warranted); and

(c) there was still inherent (i.e. Knightian) uncertainty in what was coming next on a day-to-day basis.
The limits of shorting a stock

At the end of a brief post wrapped around this advertisment by the not-strictly-declared-bankrupt-yet-but-certainly-nationalised Kaupthing Bank, John Hempton observes:

I considered shorting Kaupthing several times – but did not (in part because of the cost and difficulty of borrowing the shares). Banks like Kaupthing might be insane criminal organisations – but they were also impossible to short because they might stay solvent longer than you… Three doublings and your short has become very painful – even if you are paid in the end. Add to that a 25 percentage point borrow cost for the shares and there was little chance of making money unless you shorted right at the end. Oh, and your profit (if any) was realised in Icelandic Krona – and they turned out to be worth much less than you would have hoped. It is hard to make money of this stuff – even when the end-outcome is obvious.

I do wonder how those three reasons — the market can stay insane longer than you can stay solvent, the cost of borrowing, and the fact that it was in a minor currency — rank and interact with each other for the market as a whole for short selling stock.  Given the involvement of Icelandic banks in the credit boom and — I assume — similar borrowing costs for shorting across “well developed” financial markets, the case of the Icelandic banks might arguably represent an opportunity to back out the scale of the minor-currency impediment.

A pragmatic libertarian defense of the bank bailouts

Tyler Cowen is defending the bank bailouts in America: 25 Aug, 27 Aug, 28 Aug.  I generally like what he says.  I want to highlight the third post in particular:

General pro-market or anti-government arguments don’t rule out the recent bailouts.  Let’s take the hardest, least Friedman-friendly case, the insolvent banks.  For insolvent banks (and for some of the illiquid banks, which might have failed without bailouts), the alternative to those bailouts is calling in deposit insurance and the bankruptcy courts, both of which are, for better or worse, forms of government intervention.  In particular today’s bankruptcy procedures are ill-suited for disposing of a large financial institution in a timely manner and this can be considered a form of gross government failure.

Note that even when the Fed “bails out” a large investment bank, or insurance company, they are checking a chain reaction which would likely spread to some commercial banks, thus bringing in deposit insurance as well, not to mention further bankruptcies.  And that’s not even considering that Congress probably would have stepped in, I’m just looking at laws already on the books.

So if you’re “opposed to financial bailouts,” as a libertarian, you’re not for the market.  You’re saying that one scheme for governmental disposition is better than another.  Of course you are entitled to that opinion but the sheer force of libertarian doctrine is not necessarily on your side.  The general pro-market and anti-government arguments are not necessarily on your side.  I think it is quite plausible for a libertarian to believe that the Fed is “less bad” than the bankruptcy courts and the FDIC.

Now, all things considered, I don’t see why this “libertarian two-step” move should be needed.  I think it’s enough to simply ask whether the bailouts were a good idea and proceed accordingly.  But if you’re concerned about compatibility with libertarian principle, this is one simple way of seeing why my view fits right in.  In fact I think it is the more libertarian of the views under consideration, as it keeps the very worst of the government interventions on the table at bay.

No doubt some libertarians will counter that the FDIC and bankruptcy courts ought not to exist either (I disagree with that – while neither is perfect, they’re both needed.  But then, I’m hardly a libertarian), but that misses the point of Tyler’s title for the post:  “A second-best theory of libertarian bailouts”.  The world of second-best is the real world.  It accepts that things are currently as they are and asks what is best given the current state of the world, not in all possible worlds.

In which I respectfully disagree with Paul Krugman

Paul Krugman [Ideas, Princeton, Unofficial archive] has recently started using the phrase “jobless recovery” to describe what appears to be the start of the economic recovery in the United States [10 Feb, 21 Aug, 22 Aug, 24 Aug].  The phrase is not new.  It was first used to describe the recovery following the 1990/1991 recession and then used extensively in describing the recovery from the 2001 recession.  In it’s simplest form, it is a description of an economic recovery that is not accompanied by strong jobs growth.  Following the 2001 recession, in particular, people kept losing jobs long after the economy as a whole had reached bottom and even when employment did bottom out, it was very slow to come back up again.  Professor Krugman (correctly) points out that this is a feature of both post-1990 recessions, while prior to that recessions and their subsequent recoveries were much more “V-shaped”.  He worries that it will also describe the recovery from the current recession.

While Professor Krugman’s characterisations of recent recessions are broadly correct, I am still inclined to disagree with him in predicting what will occur in the current recovery.  This is despite Brad DeLong’s excellent advice:

  1. Remember that Paul Krugman is right.
  2. If your analysis leads you to conclude that Paul Krugman is wrong, refer to rule #1.

This will be quite a long post, so settle in.  It’s quite graph-heavy, though, so it shouldn’t be too hard to read. 🙂

Professor Krugman used his 24 August post on his blog to illustrate his point.  I’m going to quote most of it in full, if for no other reason than because his diagrams are awesome:

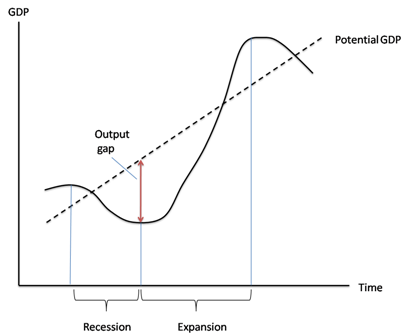
First, here’s the standard business cycle picture:

DESCRIPTION

Real GDP wobbles up and down, but has an overall upward trend. “Potential output” is what the economy would produce at “full employment”, which is the maximum level consistent with stable inflation. Potential output trends steadily up. The “output gap” — the difference between actual GDP and potential — is what mainly determines the unemployment rate.

Basically, a recession is a period of falling GDP, an expansion a period of rising GDP (yes, there’s some flex in the rules, but that’s more or less what it amounts to.) But what does that say about jobs?

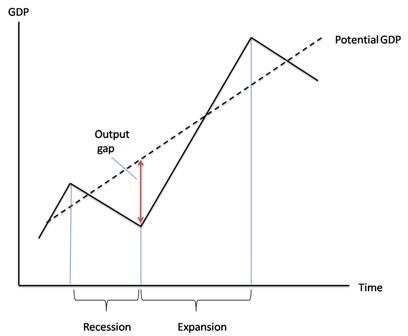
Traditionally, recessions were V-shaped, like this:

DESCRIPTION

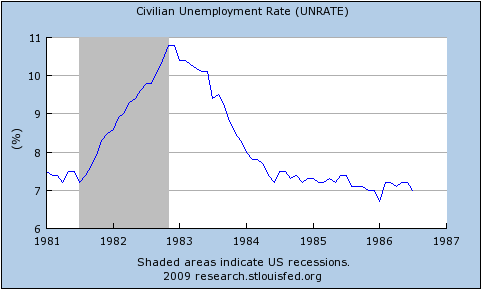
So the end of the recession was also the point at which the output gap started falling rapidly, and therefore the point at which the unemployment rate began declining. Here’s the 1981-2 recession and aftermath:

DESCRIPTION

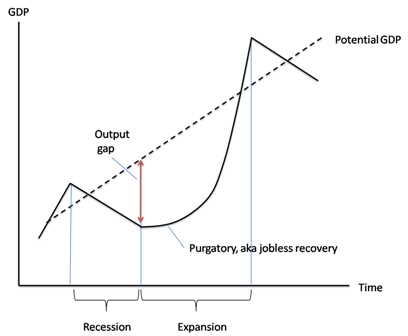
Since 1990, however, growth coming out of a slump has tended to be slow at first, insufficient to prevent a widening output gap and rising unemployment. Here’s a schematic picture:

DESCRIPTION

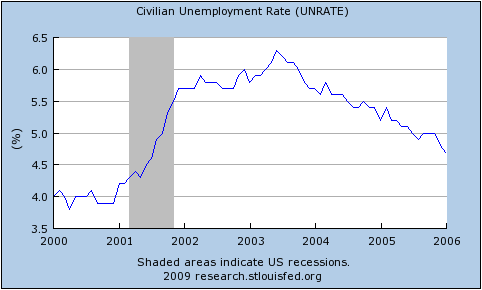
And here’s the aftermath of the 2001 recession:

DESCRIPTION

Notice that this is NOT just saying that unemployment is a lagging indicator. In 2001-2003 the job market continued to get worse for a year and a half after GDP turned up. The bad times could easily last longer this time.

Before I begin, I have a minor quibble about Prof. Krugman’s definition of “potential output.”  I think of potential output as what would occur with full employment and no structural frictions, while I would call full employment with structural frictions the “natural level of output.”  To me, potential output is a theoretical concept that will never be realised while natural output is the central bank’s target for actual GDP.  See this excellent post by Menzie Chinn.  This doesn’t really matter for my purposes, though.

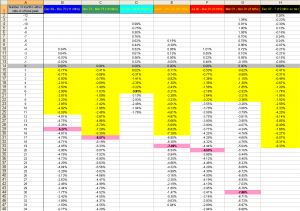
In everything that follows, I use total hours worked per capita as my variable since that most closely represents the employment situation witnessed by the average household.  I only have data for the last seven US recessions (going back to 1964).  You can get the spreadsheet with all of my data here: US_Employment [Excel].  For all images below, you can click on them to get a bigger version.

The first real point I want to make is that it is entirely normal for employment to start falling before the official start and to continue falling after the official end of recessions.  Although Prof. Krugman is correct to point out that it continued for longer following the 1990/91 and 2001 recessions, in five of the last six recessions (not counting the current one) employment continued to fall after the NBER-determined trough.  As you can see in the following, it is also the case that six times out of seven, employment started falling before the NBER-determined peak, too.

Hours per capita fell before and after recessions

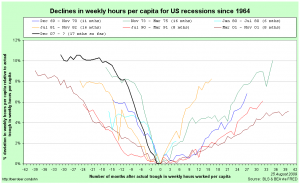
Prof. Krugman is also correct to point out that the recovery in employment following the 1990/91 and 2001 recessions was quite slow, but it is important to appreciate that this followed a remarkably slow decline during the downturn.  The following graph centres each recession around it’s actual trough in hours worked per capita and shows changes relative to those troughs:

Hours per capita relative to and centred around trough

The recoveries following the 1990/91 and 2001 recessions were indeed the slowest of the last six, but they were also the slowest coming down in the first place.  Notice that in comparison, the current downturn has been particularly rapid.

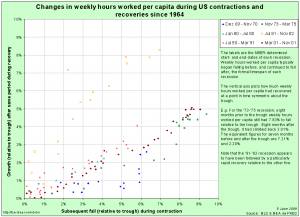
We can go further:  the speed with which hours per capita fell during the downturn is an excellent predictor of how rapidly they rise during the recovery.  Here is a scatter plot that takes points in time chosen symmetrically about each trough (e.g. 3 months before and 3 months after) to compare how far hours per capita fell over that time coming down and how far it had climbed on the way back up:

ComparingRecessions_20090605_Symmetry_Scatter_All

Notice that for five of the last six recoveries, there is quite a tight line describing the speed of recovery as a direct linear function of the speed of the initial decline.  The recovery following the 1981/82 recession was unusually rapid relative to the speed of it’s initial decline.  Remember (go back up and look) that Prof. Krugman used the 1981/82 recession and subsequent recovery to illustrate the classic “V-shaped” recession.  It turns out to have been an unfortunate choice since that recovery was abnormally rapid even for pre-1990 downturns.

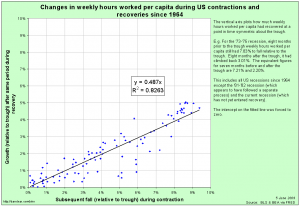
Excluding the 1981/82 recession on the basis that it’s recovery seems to have been driven by a separate process, we get quite a good fit for a simple linear regression:

ComparingRecessions_20090605_Symmetry_Scatter_Excl_81-82

Now, I’m the first to admit that this is a very rough-and-ready analysis.  In particular, I’ve not allowed for any autoregressive component to employment growth during the recovery.  Nevertheless, it is quite strongly suggestive.

Given the speed of the decline that we have seen in the current recession, this points us towards quite a rapid recovery in hours worked per capita (although note that the above suggests that all recoveries are slower than the preceding declines – if they were equal, the fitted line would be at 45% (the coefficient would be one)).

Article Summary: Noisy Directional Learning and the Logit Equilibrium

The paper is here (ungated).  The ideas.repec entry is here.  I believe that this (1999) was an early version of the same.  The authors are Simon P. Anderson [Ideas, Virginia] , Jacob K. Goeree [Ideas, CalTech] and Charles A. Holt [Ideas, Virginia].  The full reference is:

Anderson, Simon P.; Goeree, Jacob K. and Holt, Charles A., “Noisy Directional Learning and the Logit Equilibrium.” Scandinavian Journal of Economics, Special Issue in Honor of Reinhard Selten, 2004, 106(3), pp. 581-602, September 2004

The abstract:

We specify a dynamic model in which agents adjust their decisions toward higher payoffs, subject to normal error. This process generates a probability distribution of players’ decisions that evolves over time according to the Fokker–Planck equation. The dynamic process is stable for all potential games, a class of payoff structures that includes several widely studied games. In equilibrium, the distributions that determine expected payoffs correspond to the distributions that arise from the logit function applied to those expected payoffs. This ‘‘logit equilibrium’’ forms a stochastic generalization of the Nash equilibrium and provides a possible explanation of anomalous laboratory data.

This is a model of bounded rationality inspired, in part, by experimental results.  It provides a stochastic equilibrium (i.e. a distribution over choices) that need not coincide with, nor even be centred around, the Nash equilibrium.  The summary is below the fold.

Continue reading “Article Summary: Noisy Directional Learning and the Logit Equilibrium”

The end of the London evening freesheets? (thank god)

The Murdoch Empire ™ has decided to pull the plug on their free newspaper for the going-home-on-the-tube market, The London Paper, after making a pre-tax loss of £12.9 million in the year to June 2008.

That they’re hemorrhaging cash right now is no surprise since advertising expenditure is strongly pro-cyclical — it plummets in a recession and explodes in a boom.  To some extent, they’ve been unfortunate that the credit crisis and it’s associated advertising caution has been around for two of their three years and obviously the competition with Associated Newspapers’ London Lite won’t have helped.  Nevertheless, I’m not sure that it was ever a viable business model and frankly, even if it were, I’m glad that they’ve folded.  Ian Burrell puts it mildly when he says:

For the past three years, the sight of purple-and-mauve jacketed vendors thrusting free newspapers into the hands of office workers as they headed home from work has been a familiar feature in the capital.

“Thrusting” is the correct word to use, but I would prefix it with a few choice adverbs, “obnoxiously” being the most polite.  The vendors are seriously rude.  They make a deliberate point of blocking traffic and getting in your face.  It is genuinely infuriating — I find myself wanting to scream at them — but I know that they’re just doing what they’re told to do.

On their way home from work, nobody cares which of the free papers they read.  Since the papers themselves are desperate to get your eyeballs, the ideal economic situation would therefore be for them to pay you to choose them.  But that’s impossible on a practical level, so instead they end up forcing a non-monetary cost on everybody by slowing everyone down and annoying the hell out of people.

Since Associated Newspapers still have a 24% stake in the Evening Standard, this will probably mean the end of the afternoon freesheet (I imagine that the Metro in the morning will stick around), but even if it doesn’t, it will almost certainly mean the end of the obnoxious vendors forcing themselves on people.  They’ll just stick the London Lite in the same bins that they use for the Metro instead.  Presumably those vendors are being paid (minimum wage, I would guess) and so getting rid of them might make it narrowly profitable if there is just one afternoon freesheet.

Hallelujah.

A question for behavioural economists

How true is the old adage “easy come, easy go”?  More formally, is it fair to suggest that an individual’s marginal propensity to consume (MPC) — the share of an extra dollar of income that they would spend on consumption rather than save — depends on the origin of the income?  The traditional wisdom would suggest that:

MPC (fortuitous income) > MPC (hard-earned income)

Have there been any studies on this?  If so, have there been any studies that apply the results to the evolution of US inequality in income and consumption?

US government debt

Greg Mankiw [Harvard] recently quoted a snippet without comment from this opinion piece by Kenneth Rogoff [Harvard]:

Within a few years, western governments will have to sharply raise taxes, inflate, partially default, or some combination of all three.

Reading this sentence frustrated me, because the “will have to” implies that these are the only choices when they are not.  Cutting government spending is the obvious option that Professor Rogoff left off the list, but perhaps the best option, implicitly rejected by the use of the word “sharply“, is that governments stabilise their annual deficits in nominal terms and then let the real growth of the economy reduce the relative size of the total debt over time.  Finally, there is an implied opposition to any inflation, when a small and stable rate of price inflation is entirely desirable even when a country has no debt at all.

Heck, we can even have annual deficits increase every year, so long as the nominal rate of growth plus the accrual of interest due is less than the nominal growth rate (real + inflation) of the economy as a whole and you’ll still see the debt-to-GDP ratio falling over time.

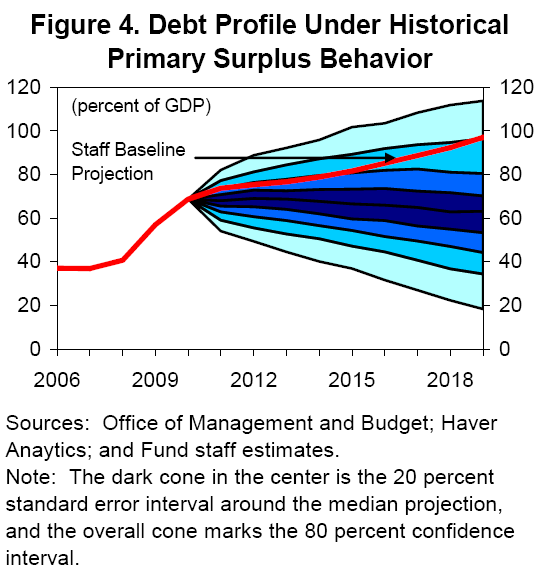
Via Minzie Chinn [U. of Wisconsin], I see that the IMF has a new paper looking at the growth rates of potential output, and the likely path of government debt in the aftermath of the credit crisis.  Using the the historical correlation between the primary surplus, debt, and output gap, they ran some stochastic simulations of how the debt-to-GDP ratio for America is likely to develop over the next 10 years.  Here’s the upshot (from page 37 of the paper):

IMF_US_debt_profile

Here is their text:

Combining the estimated historical primary surplus reaction function with stochastic forecasts of real GDP growth and real interest rates—and allowing for empirically realistic shocks to the primary surplus—imply a much more favorable median projection but slightly larger risks around the baseline. If the federal government on average adjusts the primary surplus as it has done in the past—implying a stronger improvement in the primary balance than under the baseline projections—the probability that debt would exceed 67 percent of GDP by year 2019 would be around 40 percent (Figure 4). Notably, with 80 percent probability, debt would be lower than the level it would reach under staff’s baseline by 2019. [Emphasis added]

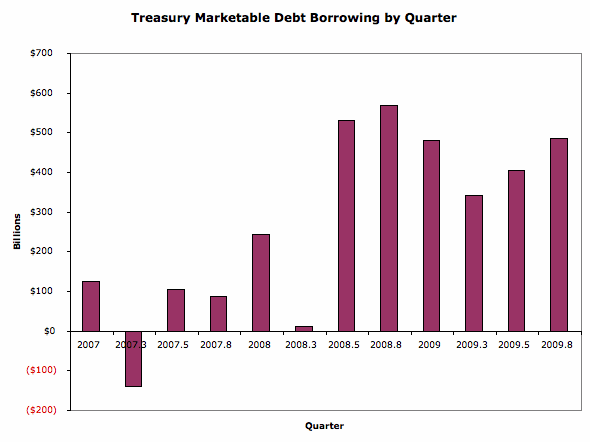
So I am not really worried about debt levels for America.  To be frank, neither is the the market, either, despite what you might have heard.  How do I know this?  Because the market, while clearly not perfectly rational, is rational enough to be forward-looking and if they thought that US government debt was a serious problem, they wouldn’t really want to buy any more of that debt today.  But the US has been selling a lot of new bonds (i.e. borrowing a lot of money) lately and the prices of government bonds haven’t really fallen, so the interest rates on them haven’t really gone up.  Here is Brad DeLong [Berkeley]:

[A] sharp increase in Treasury borrowings is supposed to carry a sharp increase in interest rates along with it to crowd out other forms of interest sensitive spending, [but it] hasn’t happened. Hasn’t happened at all:

Treasury marketable debt borrowing by quarterTreasury yield curve

It is astonishing. Between last summer and the end of this year the U.S. Treasury will expand its marketable debt liabilities by $2.5 trillion–an amount equal to more than 20% of all equities in America, an amount equal to 8% of all traded dollar-denominated securities. And yet the market has swallowed it all without a burp…

I don’t want to bag on Professor Rogoff. The majority of his piece is great: it’s a discussion of fundamental imbalances that need to be dealt with. You should read it. It’s just that I’m a bit more sanguine about US government debt than he appears to be.

Demand for sex in Japan

Mentioning sex in a blog post is a great way to generate some interesting traffic.  The last time I filled some time writing about it (on the rise of public sexuality, the rationality of prostitution and the extent of human trafficking), I got hits via some very odd queries on Google.

Titillation aside,  prostitution is a tremendously interesting topic in economics .  As John Hempton discussed initially in July 2008 and more extensively in May 2009, the price of prostitution is enormously flexible, unlike prices (and wages) in most industries.  That means that when, as John discussed, a country is operating under a fixed exchange rate and only prices can adjust in response to a macroeconomic shock, the sex industry will almost certainly move both first and furthest.

But because prostitution has very flexible wages and prices, that also makes it a candidate proxy for estimating changes in the potential output of an economy — the output that would occur if all prices were perfectly flexible.  (Remember there are differences between potential and natural levels of output)

I mention this after reading that the Bank of Japan is conducting surveys to estimate changes in demand in the Japanese sex industry:

The survey of sex shops and restaurants was designed to better gauge demand for services, an area of the economy that’s becoming more important as exports slump. “Any study into services is most welcome,” said Martin Schulz, senior economist at Fujitsu Research Institute in Tokyo. “We’ve got hundreds of studies on exports and manufacturing. What’s needed is creative thinking on services and if that includes brothels, so be it.” … While services including restaurants and retailing make up about 60 percent of gross domestic product, Japan’s economy has risen and fallen with the strength of its exports.

(Hat tip:  Tyler Cowen).

Whither baseload demand?

John Quiggin has a post in which he argues that, if baseload demand exists in any meaningful sense, it is much lower than current offpeak demand.  I want to paraphrase and expand on what he said.

There is no such thing as a “natural” or baseload level of demand.  There is a demand curve that plots quantity demanded as a function of price (or if you’re trained as an economist, the other way around).  There is a 3rd dimension of “time of day” (or more strictly, time of week, if I can say that): the curve of quantity-versus-price shifts in and out over the day.  The entire thing then shifts out slowly over time as population and the economy increase.

At most, we might say that there is a region of the demand curve for the offpeak period that is highly inelastic with respect to price.  Quiggin is arguing that that region would only be for quite small amounts of power, distinctly less than we currently see in offpeak load figures.

The reason lies in the economics of our current electricity supply through coal-fired power stations. (Side note:  I’m not 100% certain of these points – if anyone can confirm or deny them, I’d be glad to hear from you):

  • There is some range in the thermal output of a single furnace (it’s not simply all or nothing), but real variation comes from switching entire furnaces off and on.
  • The cost of moving within the output range of a given furnace is essentially just the fuel cost; the concurrent manpower required and the maintenance needs accrued are unchanged.
  • There are economies of scale in concurrent manpower when increasing the number of furnaces.  Moving from one furnace to two does increase the staff requirement, but it does not double it.
  • There are significant one-time costs associated with starting (and possibly also with shutting down) a furnace, largely due to accruing future maintenance costs.  This means that once you start a furnace, you want to keep it running as long as possible so as to amortise that cost over the greatest amount of output.

The upshot of these points (and all of them point in the same direction) is that a cost-minimising coal-fired power station is one with many furnaces that are shut down as rarely as possible.  In other words, they ideally want to supply a large and constant amount of power to the grid.

But the demand curve at 3pm is a lot further out than at 3am.  The coal powered stations can handle this a little bit by scheduling all non-emergency maintenance overnight, but ultimately, they face a conundrum:  the demand simply doesn’t exist — at any price — to meet their cost-minimising supply in the dead of night.  So they compromise by shutting down some furnaces (which raises the average cost of the remaining power generated) and lowering the offpeak price by half (which lowers the average revenue they receive for that power) in order to raise the quantity demanded.

Quiggin is contesting that the increase in quantity demanded during offpeak is significant compared to the “true baseload” demand, the quantity that would be demanded at 3am at just about any price.

In contrast, solar power, in particular, would have supply shifting in and out over the day along with demand.