Restarting running: 100 days in

Running_30Oct2009

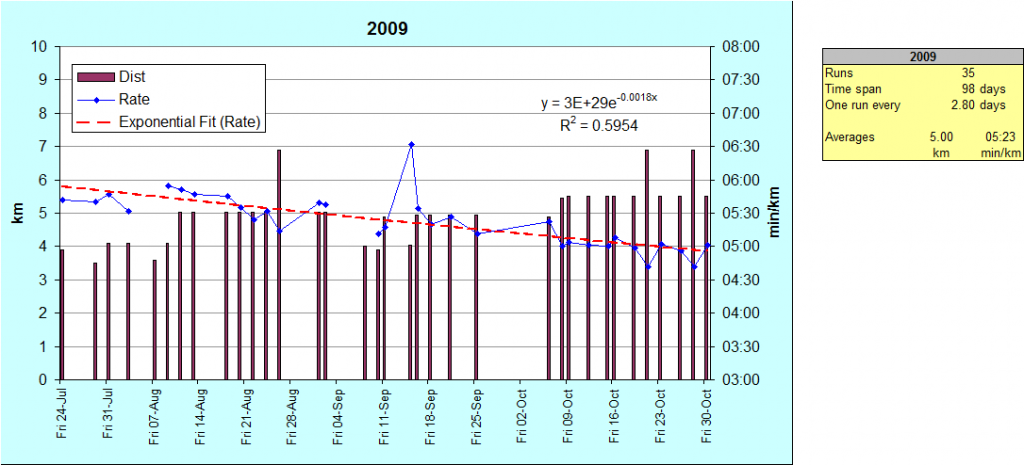
Between 1999 and 2008 inclusive, the best I ever managed in a single block was a pathetic 17 runs over 41 days.  In 1998 I did manage 37 runs in a “block” but it was haphazard, with several two-week breaks and a couple of spurts of 5 runs per week that were, frankly, dangerous.  It took me 128 days (18 and a half weeks) to get through those 37.  I should reach 37 this time after 103 days (14 and a half weeks).  I attribute my sticking with it this time to:

  1. Running shorter distances than I have in the past
  2. Resisting the urge to increase my speed too quickly
  3. Never running more than three times per week
  4. This

Media bias and people who are WAAAY out on the political spectrum

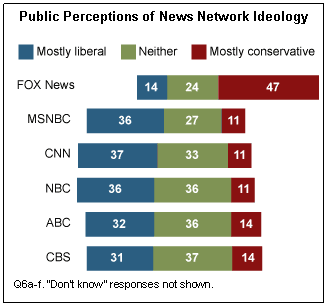
Andrew Sullivan points to this research by Pew on how American’s view the bias of the major television networks.  It’s nicely summarised in this diagram (from Pew):

Public perceptions of news network ideology

Andrew makes the obvious and easy comment bashing on Fox:

Clearly the public understands that the network MSM is skewed to the left. But there’s a difference of magnitude between that assessment and that of Fox. Quite simply, most Americans see Fox for what it is: an appendage of a political operation, not a journalistic one. Its absurd distortions, its relentless attacks on Obama from the very start, its hideously shrill hosts, and its tawdry, inflammatory chat all put it in a class by itself.

Personally, I don’t necessarily agree that the MSM is, on average, biased to the left (although maybe that’s just my internal biases talking).  I’ll get to that in a moment, but first …

14% of respondents consider Fox News to be mostly liberal in it’s bias!  That’s almost one in seven.  Just how far out in the political spectrum are those people? What would Fox need to do to convince them that they were neutral?  Actively promote the KKK?

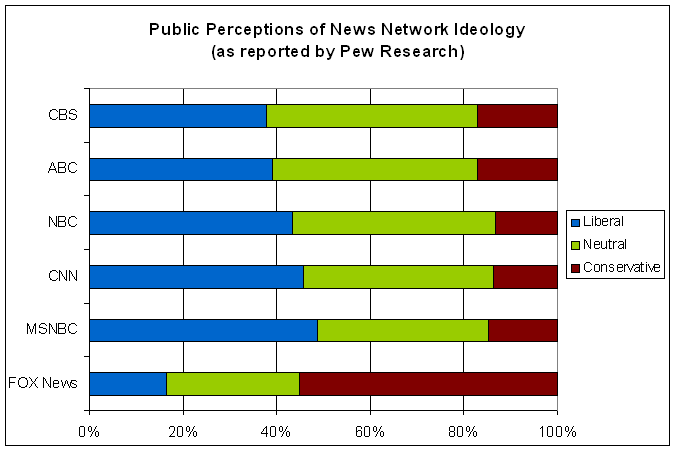
Back to perceptions of bias.  Here is another graphical illustration of the Pew Research data:

US Perceptions of MSM Bias (Pew)

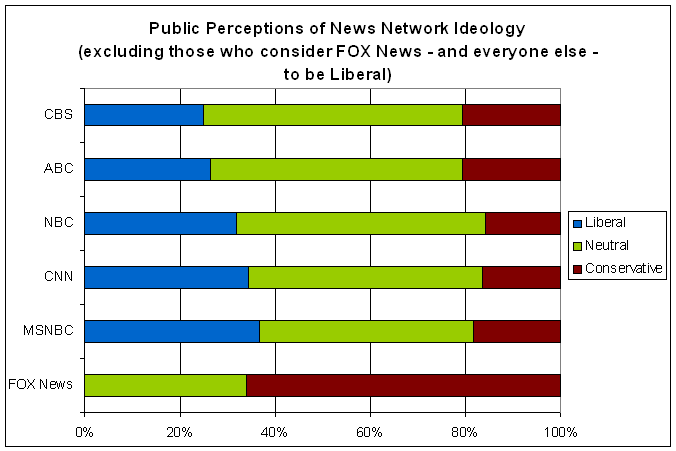
It seems safe to assume that anybody who thinks Fox News is liberal will consider the rest liberal as well, so that explains a large fraction of the “liberal” responses for the rest.  So, excluding the people who are personally so conservative as to consider Fox News to have a pro-liberal bias, this is what it looks like:

US Perceptions of MSM Bias (excl. people who think Fox is liberal)

In other words, when we restrict our attention to people who are not insane [1], the American public agrees with me: by and large, the non-Fox networks are pretty evenly balanced, although MSNBC  is pro-liberal.

[1] Okay, they may not be insane.  I have no evidence than any larger fraction of them are insane than in the rest of the population.  But they do strike me as having some pretty whacky personal beliefs.

The death throes of US newspapers?

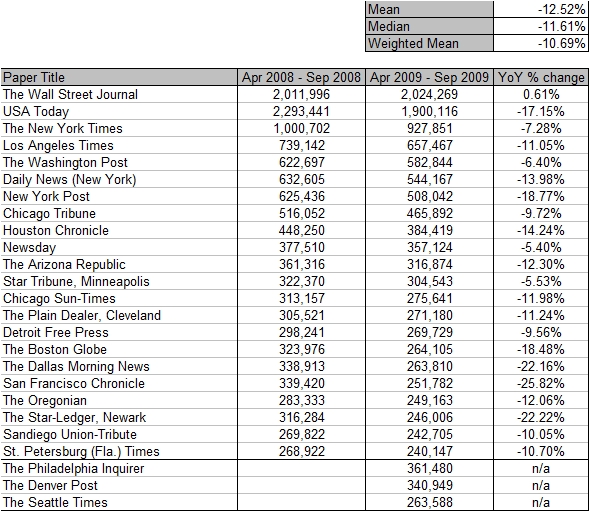
Via Megan McArdle’s excellent commentary, I discovered the Mon-Fri daily circulation figures for the top 25 newspapers in the USA.  Megan’s words:

I think we’re witnessing the end of the newspaper business, full stop, not the end of the newspaper business as we know it. The economics just aren’t there. At some point, industries enter a death spiral: too few consumers raises their average costs, meaning they eventually have to pass price increases onto their customers. That drives more customers away. Rinse and repeat . . .

[…]

The numbers seem to confirm something I’ve thought for a while: we’re eventually going to end up with a few national papers, a la Britain, rather than local dailies. The Wall Street Journal, the Washington Post, and the New York Times (sorry, conservatives!) are weathering the downturn better than most, and it’s not surprising: business, politics, and national upper-middlebrow culture. But in 25 years, will any of them still be printing their product on the pulped up remains of dead trees? It doesn’t seem all that likely.

For those of you that like your information in pictoral form, here it is:

First, the data.  Look at the Mean/Median/Weighted Mean figures.  That really is an horrific collapse in sales.

US_Newspaper_circulation_data

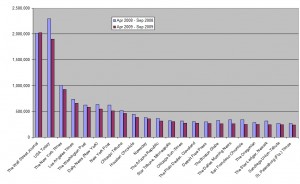
Second, the distribution (click on the image for a full-sized version):

US_Newspaper_circulation_distribution

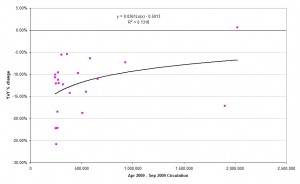
Finally, a scatter plot of year-over-year change against the latest circulation figures (click on the image for a full-sized version):

US_Newspaper_circulation_scatterplotAs Megan alluded in the second paragraph I quoted, there appears to be a weak relationship between the size of the paper and the declines they’ve suffered, with the bigger papers holding up better.  The USA Today is the clear exception to that idea.  Indeed, if the USA Today is excluded from the (already very small!) sample the R^2 becomes 30%.

To really appreciate just how devestating those numbers are, you need to combine it with advertising figures.  Since newspapers take revenue from both sales (circulation) and advertising, the fact that advertising revenue has also collapsed, as it always does in a recession, means that newspapers have taken not just one but two knives to the chest.

Here’s advertising expenditure in newspapers over recent years, taken from here:

Year Expenditure (millions of dollars) Year-over-year % change
2005 47,408
2006 46,611 -1.7%
2007 42,209 -9.2%
2008 34,740 -17.7%

Which is ugly.  Remember, also, that this expenditure is nominal.  Adjusted for inflation, the figures will be worse.

So what do you do when your ad sales and your circulation figures both fall by over 15%?  Oh, and you can’t really cut costs any more because, as Megan says:

For twenty years, newspapers have been trying to slow the process with increasingly desperate cost cutting, but almost all are at the end of that rope; they can’t cut their newsroom or production staff any further and still put out a newspaper. There just aren’t enough customers who are willing to pay for their product what it costs to produce it.

Which, in economics speak, means that the newspaper business has a large fixed cost component that isn’t particularly variable even in the long run.

Tyler Cowen, in an excellent post that demonstrates precisely why I read him daily, says:

I believe with p = 0.6 that the world is in for a “great disruption.”  It has come to MSM first but it will not end there.  In the longer run I am optimistic about the results of this change — computers will free up lots of human labor — but in the meantime it will have drastic implications for income redistribution, across both individuals and across economic sectors.  For a core metaphor, the internet displacing paid journalism and classified ads is a good place to start.  The value of newspapers has been sucked into Google.

[…]Once The Great Disruption becomes more evident, entertainment will be very very cheap.

Which may well be true, but will be cold comfort for all of those traditional journalists out there.

“L’Heure espagnole” and “Gianni Schicchi”

Last night Dani and I went to the Royal Opera thanks to the glories of Student Standby tickets:  £10 each!

It’s luck of the draw for where you end up sitting.  Last night we were in the nose-bleeds, but at the ROH, even there you get a perfect view and no acoustic trade-off that my untrained ears can notice.  We’ve previously managed to get seats that would ordinarily cost hundreds of pounds.

The Royal Opera - L'Heure espagnole

We saw two one-act comedic operettasRavel‘s L’Heure espagnole (the poor-quality photo above is from that – Look!  Giant breasts at the opera!) and Puccini‘s Gianni Schicchi.  Freakin’ hilarious.

One in 20 Australians play the pokies WEEKLY

Stephen Lunn, writing at The Australian, channels the Productivity Commission’s recent report:

[The Productivity Commission] finds the legal ban in Australia on online gaming is a failure, with betting traffic heading to overseas sites that offer little in the way of consumer protection.

In its draft report on gambling, the first in-depth national look at Australia’s gambling industry in a decade, the commission finds that gamblers are losing $18 billion a year, of which $12 billion is lost on gaming machines.

It estimates that around 5 per cent of adults play weekly or more on gaming machines, and 15 per cent of those, or around 125,000 people, are problem gamblers.

Productivity commissioner Gary Banks says “a large number of people have problems with their gambling (and) it is vital that they are given a tool to achieve greater control”.

The commission recommends the reduction in the amount that can be lost on a gaming machine from its current upper limit of $1200 an hour to $120 per hour, and giving people a choice when they sit down on how much they spend, using the latest technologies.

[Emphasis added by John Barrdear]

If we assume that state governments and pubs don’t want to get rid of pokies because they’re so dependent on the revenues, then surely the only serious hope for enacting this would be for it to be a federal law.

Lifting the ban on online gambling and permitting pokies but limiting the loss rate seem sensible ideas to me – they leave people with the freedom to gamble if they wish, but limit the loss to largely one of time rather than having the option of putting the house down.

Of course, the softest still-ultimately-effective policy would be to simply hold the upper limit on loss rates constant while letting the minimum wage and welfare benefits rise with inflation so that the limit falls both in real terms (relative to the cost of living) and relative to household income.

Be careful interpreting Lagrangian multipliers

Last year I wrote up a derivation of the New Keynesian Phillips Curve using Calvo pricing.  At the start of it, I provided the standard pathway from the Dixit-Stiglitz aggregator for consumption to the constant own-price elasticity individual demand function.  Let me reproduce it here:

There is a constant and common elasticity of substitution between each good: $$\varepsilon>1$$.  We aggregate across the different consumptions goods:

$$!C=\left(\int_{0}^{1}C\left(i\right)^{\frac{\varepsilon-1}{\varepsilon}}di\right)^{\frac{\varepsilon}{\varepsilon-1}}$$

$$P\left(i\right)$$ is the price of good i, so the total expenditure on consumption is $$\int_{0}^{1}P\left(i\right)C\left(i\right)di$$

A representative consumer seeks to minimise their expenditure subject to achieving at least $$C$$ units of aggregate consumption. Using the Lagrange multiplier method:

$$!L=\int_{0}^{1}P\left(i\right)C\left(i\right)di-\lambda\left(\left(\int_{0}^{1}C\left(i\right)^{\frac{\varepsilon-1}{\varepsilon}}di\right)^{\frac{\varepsilon}{\varepsilon-1}}-C\right)$$

The first-order conditions are that, for every intermediate good, the first derivative of $$L$$ with respect to $$C\left(i\right)$$ must equal zero. This implies that:

$$!P\left(i\right)=\lambda C\left(i\right)^{\frac{-1}{\varepsilon}}\left(\int_{0}^{1}C\left(j\right)^{\frac{\varepsilon-1}{\varepsilon}}dj\right)^{\frac{1}{\varepsilon-1}}$$

Substituting back in our definition of aggregate consumption, replacing $$\lambda$$ with $$P$$ (since $$\lambda$$ represents the cost of buying an extra unit of the aggregate good $$C$$) and rearranging, we end up with the demand curve for each intermediate good:

$$!C\left(i\right)=\left(\frac{P\left(i\right)}{P}\right)^{-\varepsilon}C$$

If that Lagrangian looks odd to you, or if you’re asking where the utility function’s gone, you’re not alone.  It’s obviously just the dual problems of consumer theory – the fact that it doesn’t matter if you maximise utility subject to a budget constraint or minimise expenditure subject to a minimum level of utility – but what I want to focus on is the resulting interpretation of the lagrangian multipliers.

Let’s rephrase the problem as maximising utility, with utility a generic function of aggregate consumption, $$U\left(C\right)$$.  The Lagrangian is then:

$$!L=U\left(\left(\int_{0}^{1}C\left(i\right)^{\frac{\varepsilon-1}{\varepsilon}}di\right)^{\frac{\varepsilon}{\varepsilon-1}}\right)+\mu\left(M-\int_{0}^{1}P\left(i\right)C\left(i\right)di\right)$$

The first-order conditions are:

$$!U’\left(C\right)\left(\int_{0}^{1}C\left(j\right)^{\frac{\varepsilon-1}{\varepsilon}}dj\right)^{\frac{1}{\varepsilon-1}}C\left(i\right)^{\frac{-1}{\varepsilon}}=\mu P\left(i\right)$$

Rearranging and substituting back in the definition for $$C$$ then gives us:

$$!C\left(i\right)=\left(P\left(i\right)\frac{\mu}{U’\left(C\right)}\right)^{-\varepsilon}C$$

In the first approach, $$\lambda$$ represents the cost of buying an extra unit of the aggregate good $$C$$, which is the definition of the aggregate price level.  In the second approach, $$\mu$$ represents the cost of buying an extra unit of income, which is not the same thing.  Comparing the two results, we can see that:

$$!\lambda=P=\frac{U’\left(C\right)}{\mu}$$

Which should cause you to raise an eyebrow.  Why aren’t the two multipliers just the inverses of each other?  Aren’t they meant to be?  Yes, they are, but only when the two problems are equivalent.  These two problems are slightly different.

In the first one, to be equivalent, the term in the lagrangian would need to be $$V – U\left(\left(\int_{0}^{1}C\left(i\right)^{\frac{\varepsilon-1}{\varepsilon}}di\right)^{\frac{\varepsilon}{\varepsilon-1}}\right)$$, which would give us Hicksian demands as a function of utility level ($$V$$).  But since we assumed that utility is only a function of aggregate consumption, then in order to pin down a level of utility, it’s sufficient to pin down a level of aggregate consumption; and that is useful to us because a) a level of utility doesn’t mean much to us as macroeconomists but a level of aggregate consumption does and b) it means that we can recognise the lagrange multiplier as the aggregate price level.

Which, when you think about it, makes perfect sense.  Extra income must be adjusted by the marginal value of the extra consumption it affords in order to arrive at the price that the (representative) consumer would be willing to pay for that consumption.

In other words:  be careful when interpreting your Lagrangian multipliers.
Just a smidgen more on US healthcare reform

My previous comment on US healthcare reform, which was actually a comment on the current Australian system, got quite a few eyeballs thanks to John Hempton’s shout-out.  Anyway, I thought I’d highlight a couple of new developments for my little audience.

First, Republican Senator Olympia Snowe (of Maine), who sits on the Senate Finance Committee, has said that she will vote in favour of the suggested bill being proposed by that committee’s chairman, Max Baucus.  That is good for the Democrats as it will provide valuable political cover.  It’s no guarantee that she will vote in favour of whatever the Senate as a whole end up producing, or for whatever the Senate and House then negotiate as the final bill, but it’s still a significant move and the probability of her voting for those later versions has just increased.

Second, we have the fact that the healthcare insurance industry has recently done an about-face, from actively promoting reform to actively fighting against it.  Nate Silver points out why:

Take a look at what’s happened to the share prices of the six largest publicly-traded health insurance companies since Labor Day, which was about the point at which the Democrats appeared to regain their footing — at least up to a point — on health care.

Weighted for market capitalization, these insurance stocks have lost 11 percent of their value since Labor Day, wiping out about $10 billion in value. And that’s understating the case since the major indices have gained 5-8 percent over the same period — the insurance industry stocks are underperforming the market by just shy of 20 percent.

So why have they tanked in the stock market?  Nate suggests two reasons:

Firstly, the individual mandate has been weakened to the point where it’s arguably a tokenish provision. There are good, policy reasons to be worried about this, although the insurance lobby’s reasons for being opposed — they’ll have less guarantee of an incoming phalanx of high-margin customers — are not necessarily the same as the public’s at large. The second factor is that the Baucus bill in certain ways treats the insurers fairly harshly, both taxing them directly as well as levying a surcharge on high-cost insurance plans.

I’d also suggest that the compromise version of the public option (that it be in the bill, but with states able to opt out if they wish [Paul Krugman, Talking Points Memo]) will have scared the insurance companies and investors as well.

Well, that didn’t take long (Trafigura)

About an hour ago I wrote about an article in The Guardian about how they had been prevented from writing about parliamentary proceedings via a court injunction.  In particular, they weren’t allowed to write about this question put before parliament:

(292409)

Paul Farrelly (Newcastle-under-Lyme): To ask the Secretary of State for Justice, what assessment he has made of the effectiveness of legislation to protect (a) whistleblowers and (b) press freedom following the injunctions obtained in the High Court by (i) Barclays and Freshfields solicitors on 19 March 2009 on the publication of internal Barclays reports documenting alleged tax avoidance schemes and (ii) Trafigura and Carter Ruck solicitors on 11 September 2009 on the publication of the Minton report on the alleged dumping of toxic waste in the Ivory Coast, commissioned by Trafigura.

The story became a Twitter sensation.  Trafigura and Carter-Ruck have been the hottest trending topics on Twitter for the last few hours, the Liberal Democrats sought an urgent debate on press freedom and now, as their journalists write furiously in the background with their editors looking over their shoulders to save time, The Guardian is reporting on their front page:

Breaking news: * LATEST: Guardian can reveal that parliamentary question from Paul Farrelly MP subjected to reporting ban was related to Trafigura toxic waste scandal. More details soon ..

Which is to say that the gag has been lifted in under (?) 24 hours.

This has all been a tremendous example of the Streisand effect, named for Barbara Streisand’s catastrophically backfiring attempt to prevent a picture of her house being made available on the internet.  While attempting to surpress attention, Trafigura and Carter-Ruck have only managed attract a huge amount of attention to themselves.

It’s a PR nightmare for them and a happy day for The Guardian.

Update 1: Here is confirmation from the Guardian.

Update 2: Here is the BBC on the matter.  By way of explaining why they did not cover the story despite not being expressly mentioned in the injunction, they say:

No injunction was served on the BBC, but ever since the Spycatcher case in the 1980s news organisations which knowingly breach an injunction served on others are in contempt of court, so the corporation too felt bound by the Guardian injunction.

Which is the equivalent of “once bitten, (forever) twice shy.”  The Beeb finishes by quoting Steven Fry’s tweet from when he discovered the good news:

Can it be true? Carter-Ruck caves in! Hurrah! Trafigura will deny it had anything to do with Twitter, but we know don’t we? We know! Yay!!!

Update 3: BBC Newsnight will have a special on Trafigura and their chemical disposals tonight.