Seasonal adjustments to unemployment in the USA

I might as well put this here.  Brad DeLong writes:

Microsoft Excel.png

Put me down as somebody who does not believe that the seasonal factor in the unemployment rate is twice as big today as it was four short years ago, or was half as big four short years ago as it was in the early 1990s…

Not that I am complaining about the BLS, you understand. If I could do better, they would already have done better. Nevertheless this is a source of nervousness…

My first thoughts:

At a first glance, the size of the seasonal adjustment factor looks like it is countercyclical to the business cycle, which immediately raises the question: Why would seasonality-based volatility in unemployment increase during a recession?

Could it just be that seasonal employment is less susceptible to business cycle movements than regular employment, so that during a recession the (relatively constant) seasonal movements look larger relative to the smaller total employment number?

Variation in US unemployment

The NY Times brings us a another wonderful graphic.  As of September 2009, white women aged 25 to 34 with a college degree had an unemployment rate of just 3.6%, while black men aged 18 to 24 without a highschool diploma had an unemployment rate of 48.5%.  Change that last group to white men aged 18 to 24 without a highschool diploma and it falls to 25.6%.

More people have jobs AND the unemployment rate is higher

This is another one for my students in EC102.

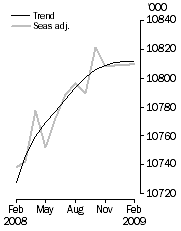
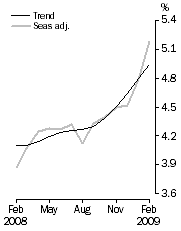
Via the always-worth-reading Peter Martin, I notice that the Australian Bureau of Statistics February release of Labour Force figures contains something interesting:  The number of people with jobs increased, but the unemployment rate still went up.  Here’s the release from the ABS:

Employed Persons Unemployment Rate
Australia Feb 2009 Employment Australia Feb 2009 Unemployment Rate

FEBRUARY KEY POINTS

TREND ESTIMATES (MONTHLY CHANGE)

  • EMPLOYMENT increased to 10,811,700
  • UNEMPLOYMENT increased to 561,100
  • UNEMPLOYMENT RATE increased to 4.9%
  • PARTICIPATION RATE increased to 65.4%

SEASONALLY ADJUSTED ESTIMATES (MONTHLY CHANGE)

EMPLOYMENT

  • increased by 1,800 to 10,810,400. Full-time employment decreased by 53,800 to 7,664,200 and part-time employment increased by 55,600 to 3,146,200.

UNEMPLOYMENT

  • increased by 47,100 to 590,500. The number of persons looking for full-time work increased by 44,400 to 426,000 and the number of persons looking for part-time work increased by 2,600 to 164,500.

UNEMPLOYMENT RATE

  • increased by 0.4 percentage points to 5.2%. The male unemployment rate increased by 0.3 percentage points to 5.1%, and the female unemployment rate increased by 0.5 percentage points to 5.3%.

PARTICIPATION RATE

  • increased by 0.2 percentage points to 65.5%.

The proximate reason is that more people want a job now than did in January.  The unemployment rate isn’t calculated using the total population, but instead uses the Labour Force, which is everybody who has a job (Employed) plus everybody who wants a job and is looking for one (Unemployed).

$$!u=\frac{U}{E+U}$$

Employment increased by 1,800, but unemployment increased by 47,100, so the unemployment rate ($$u$$) still went up.

Peter Martin also offered a suggestion on why this happened:

We’ve lost a lot of wealth and we’re worried. So those of us who weren’t looking for work are piling in.

I generally agree, but my guess would go further. Notice two things:

  • Part-time jobs went up by 55,600 and full-time jobs fell by 53,800 (the difference is the 1,800 increase in total employment).
  • The number of people looking for part-time jobs went up by only 2,600 and the number of people looking for full-time jobs rose by 44,400 (yes, I realise that there’s 100 missing – I guess the ABS has a typo somewhere).

There are plenty of other explanations, but I think that by and large, the new entrants to the Labour Force only wanted part-time work and found it pretty-much straight away – these are households that were single-income, but have moved to two-incomes out of the concern that Peter highlights.  On the other hand, I suspect that the people that lost full-time jobs have generally remained in the unemployment pool (some will have given up entirely, perhaps calling it retirement).

The aggregate result is that the economy had a shift away from full-time and towards part-time work, although the people losing the full-time jobs are not the ones getting the new part-time work.
Deriving the New Keynesian Phillips Curve (NKPC) with Calvo pricing

The Phillips Curve is an empirical observation that inflation and unemployment seem to be inversely related; when one is high, the other tends to be low.  It was identified by William Phillips in a 1958 paper and very rapidly entered into economic theory, where it was thought of as a basic law of macroeconomics.  The 1970s produced two significant blows to the idea.  Theoretically, the Lucas critique convinced pretty much everyone that you could not make policy decisions based purely on historical data (i.e. without considering that people would adjust their expectations of the future when your policy was announced).  Empirically, the emergence of stagflation demonstrated that you could have both high inflation and high unemployment at the same time.

Modern Keynesian thought – on which the assumed efficacy of monetary policy rests – still proposes a short-run Phillips curve based on the idea that prices (or at least aggregate prices) are “sticky.”  The New Keynesian Phillips Curve (NKPC) generally looks like this:

\pi_{t}=\beta E_{t}\left[\pi_{t+1}\right]+\kappa y_{t}

Where y_{t} is the (natural) log deviation – that is, the percentage deviation – of output from its long-run, full-employment trend and \beta and \kappa are parameters.  Notice that (unlike the original Phillips curve), it is forward looking.  There are criticisms of the NKPC, but they are mostly about how it is derived rather than its existence.

What follows is a derivation of the standard New Keynesian Phillips Curve using Calvo pricing, based on notes from Kevin Sheedy‘s EC522 at LSE.  I’m putting it after this vile “more” tag because it’s quite long and of no interest to 99% of the planet.

Continue reading “Deriving the New Keynesian Phillips Curve (NKPC) with Calvo pricing”