Barack Obama: winning since day 1?

Via Matthew Ylesias, I came across this piece by Chris Bowers: “Now Is Not The Time To Count Super Delegates

Right now, with the exception of NBC news, most news outlets are counting super delegates in their running delegate total for the Democratic nomination … From 1984 to 2004, the overwhelming majority of super delegates have cast their convention votes for the candidate who won more votes during the primary and caucus season. This was just as true for Mondale in 1984 as it was for Kerry in 2004. On every single occasion, large numbers of super delegates switched their early, public support for a candidate in favor of the candidate who had the most popular support from voters in Democratic primaries and participants in Democratic caucuses.

This is important stuff. For the 2008 nomination, the Democratic Party will have 3,253 pledged delegates at their August convention and 796 unpledged (or “super”) delegates. If the super-delegates break 90-10 for the winner among pledged delegates, a 1,627 vs. 1,626 split in the pledged delegates would end up as a 2,343 vs. 1,706 vote at the convention and so look like a blow-out for the winner.

Why do they do it? Because they want the public to see the Democratic Party lining up behind a clear candidate. A bitter, narrow fight on the convention floor looks like a divided party that cannot come together and lead, whereas a large win looks like momentum and inevitability. It’s also important to note that, by and large, the super-delegates are up for re-election themselves. From Wikipedia: “In 2008, the superdelegates include 221 members of the U.S. House of Representatives, 48 senators, including the District of Columbia’s two shadow senators, 31 state and territorial governors, 397 members of the Democratic National Committee, 23 distinguished party leaders, and 76 others.” Nobody wants to be running for re-election as the guy or girl who voted against their own presidential candidate.

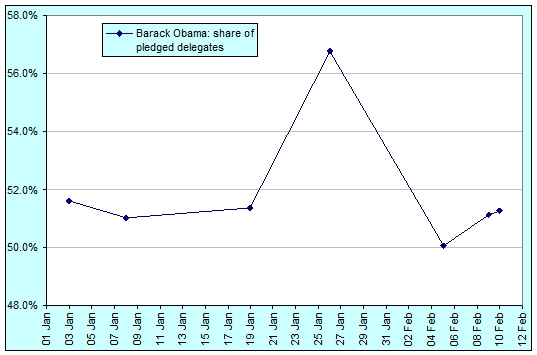
Given all that, I thought I’d have a look at how Mr. Obama and Mrs. Clinton have being going in just the pledged delegates. The data below comes mostly from CNN. Some of the counts are still just estimates. Note that I am ignoring the delegates awarded to John Edwards.


Date Barack Obama: running total Barack Obama: fraction of pledged delegates Hillary Clinton: running total Hillary Clinton: fraction of pledged delegates
3 Jan 16 51.6% 15 48.4%
8 Jan 25 51.0% 24 49.0%
19 Jan 38 51.4% 36 48.6%
26 Jan 63 56.8% 48 43.2%
5 Feb 901 50.1% 899 49.9%
9 Feb 987 51.1% 944 48.9%
10 Feb 1002 51.3% 953 48.7%

obama-ahead.jpg

In the lead up to super (dooper) Tuesday on the 5th of February, Hillary Clinton had to temporarily stump up US$5 million of her own money. Following the Maine caucus on the 10th of February, she changed her campaign manager. On the 12th of February, the states of Maryland and Virginia and the District of Columbia will vote in their primaries and the Democrats Abroad will finish taking its votes (they started on the 5th of Feb). The polls have Obama clearly in front in Maryland (by 21 points on average) and Virginia (by 17 points on average). The betting markets estimate his chances of winning in Maryland and Virginia at 97.7% and 96.0% respectively. On the 19th of February, Hawaii (where Obama was born) will have its caucus and Wisconsin will have its primary.

It’s not until Texas, Rhode Island, Vermont and Ohio on the 4th of March that pundits are predicting the next win for Hillary, but there’s no guarantee that she’ll win enough to get in front.

Perhaps the “coming from behind” story is wrong. Perhaps Barack Obama has been in front every step of the way in 2008.

Clinton seeks what from a Florida win?

This article from the FT is pretty typical at the moment:  “Clinton seeks profit from a Florida win

[F]ollowing her heavy defeat to Barack Obama in South Carolina last weekend, Mrs Clinton hopes to derive favourable publicity from her expected victory in Florida’s straw poll on Tuesday.

Almost 400,000 Floridians have already cast postal votes in the Democratic race, even though all of the candidates stuck to their pledge not to campaign there or run local advertising [after Florida had all of its Democratic delegates stripped for bringing the date of its primary forward].

Mr Obama’s camp has accused Mrs Clinton of cynicism for signalling she will ask the party to restore Florida’s delegates to the convention. Florida would have more delegates than Iowa, New Hampshire, Nevada and South Carolina combined.

Why does everyone play this as Hillary the cynical and faintly desperate candidate backing down on her pledge?  I understand why Obama’s staff are playing it that way, but why are the commentators agreeing with that view?

If she wins the nomination – and the best bet right now is that she will – then it will prove enormously valuable that she went to Florida, no matter whether their delegates get to vote for that nomination or not.  If she hadn’t gone but still won the nomination, then come November the Republican candidate would be speaking endlessly about her absence in such a key state while waxing lyrical about the democratic right of people to have their say.

Whoever the Democratic front-runner was at this stage was always going to be forced to go to Florida because of the attention that the Republicans are giving to it.  Hillary is simply making the most of it.  Barack Obama, who is behind in both the primary polls and the betting markets in most of the super-Tuesday states, cannot afford to think of November yet; if he’s looking at anything past the 5th of February, I’d be stunned.

New Hampshire and the prediction markets

Plenty of people, Paul Krugman among them, are pointing out that just like the polls (which, on average, had Obama ahead of Clinton by over 8 points), the prediction markets were plainly wrong in forecasting the outcome of the Democratic New Hampshire primary. They’ve got a point.

These are the daily closing prices on the Clinton and Obama contracts to win the New Hampshire primary from InTrade:

dem_nh_clinton.png

dem_nh_obama.png

Up until Iowa, they were fairly steady at ~60% for Clinton and ~40% for Obama, but from the 3rd of January onwards, there was a clear movement towards Obama. On the day before the primary, the markets had Obama 97.8% likely to win. On the day, Clinton won with 39.07% of the vote, while Obama received 36.47%. So why did the market get it wrong?

Paul Krugman contends that the prediction markets were just reflecting the polls and talking heads, presumably because that was all the information there was to be had. This naturally raises the question of why they were wrong (e.g. did we just witness the Bradley effect in action?), but that is not the point here. A prediction market, according to the theory, is meant to be superior to the polls in predicting outcomes because it combines information contained in the polls with information from other sources. So perhaps Krugman is right. But if he is, why did the market go so far towards Obama?

My guesses:

  • Perhaps Krugman is partially right, but the talking heads provided a positive feedback loop. The polls predicted Obama, which the markets saw. The talking heads saw the polls too (perhaps in more detail) and then spoke about it on television, but added effectively no extra information. The markets saw the talking heads and believed it to be extra information in support of the polls.
  • Like any market, the prediction markets are susceptible to bubbles. Perhaps we saw one here in the days between Iowa and New Hampshire.
  • A lack of “true” liquidity. There was plenty of nominal liquidity in these markets leading up to and during the counting, but how much of the trading was arbitrage, how much was momentum (i.e. bubble) trading and how much was “true,” changing-belief-based trading? As the counting occurred, I was watching both the leaked figures on the Drudge Report and the movement on InTrade. It seemed that the prediction market was moving steadily towards Clinton, but nowhere near as quickly as one would have expected. For example, at 9:40pm, with 46% of the vote counted, Clinton was leading 49,719 (40%) to 45,383 (36%), from which one would conclude with extremely high confidence that Clinton would win, but the market was still only putting her at 65%.
  • Perhaps – and I’m by no means certain of this last point – in order for a prediction market to work perfectly, we also need people to set the size of their position in proportion to their confidence in that prediction. So perhaps there were traders who, looking at Drudge or some other source were extremely confident that Clinton would win from quite early in the counting, but since they did not take large enough positions, they did not move the market. In other words, liquidity requirements for a successful prediction market are not just on the number of trades, but on the volume traded.

Update: Justin Wolfers, a long-time researcher in prediction markets, has an article in the WSJ highlighting how surprising the result was given the market predictions.

We were led to this research by an age-old racetrack puzzle economists call the “favorite-long shot bias“: Horse bettors historically have overbet long shots, and they win less often than their odds suggest. Our research suggests that similar biases hold in political prediction markets.

As such, Sen. Clinton’s comeback is even more stunning, as political underdogs have historically won even less often than suggested by their prediction market odds.

Historical comparisons are already being drawn between the New Hampshire primary and the famous 1948 presidential race in which President Harry S. Truman beat Republican challenger Thomas Dewey, despite the infamous “Dewey Defeats Truman” headline in the Chicago Tribune.

Yet the magnitude of the Clinton surprise is arguably even greater. Indeed, historical research by Professors Paul Rhode of the University of Arizona and Koleman Strumpf of Kansas University has shown that in the Truman-Dewey race, prediction markets had seen hope for President Truman despite his dreadful polling numbers, and he was rated an 11% chance of winning the election by election-eve. Thus, Sen. Clinton’s victory on Tuesday was more surprising than President Truman’s in 1948.

Personally, I seem to be thinking of this the other way around. Assuming that prediction markets are generally better than other forms of forecasting, I find it surprising that they got it so wrong on this occasion. Rather than thinking of the result as the equivalent of a 6-sigma event given the prediction market, I wonder what was different this time that so disturbed the market’s ability to predict?

Update 2: Okay, okay a 3-sigma event 🙂  Justin in an email:

For the polls, this was about a 3-sigma event.  For the market, which had Hillary priced at about a 7% chance [JB: Justin is referring to the WSJ market], it is about a 1.7 sigma event.  They aren’t that unusual.  Indeed, they probably happen about 7% of the time