Negative interest rates on US government debt and Brad DeLong (Updated)

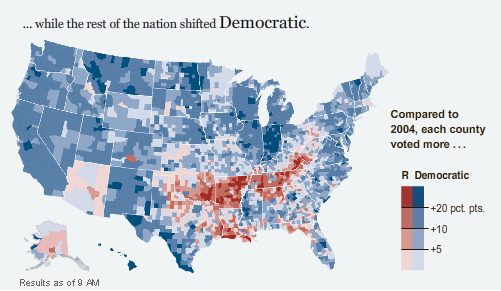
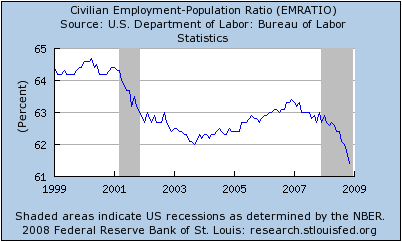
The interest rates on US government debt has turned negative (again) as a result of the enormous flight to perceived safety.  I guess they’ll be able to fund their gargantuan bailouts more easily, at least.

Brad DeLong has written a short and much celebrated essay (available on Cato and his own site) on the financial crisis and (consequently) why investors currently love government debt and hate everything else.  I’ll add my voice to those suggesting that you read the whole thing.  Here is the crux of it:

[T]he wealth of global capital fluctuates … for five reasons:

  1. Savings and Investment: Savings that are transformed into investment add to the productive physical — and organizational, and technological, and intellectual — capital stock of the world. This is the first and in the long run the most important source of fluctuations — in this case, growth — in global capital wealth.
  2. News: Good and bad news about resource constraints, technological opportunities, and political arrangements raise or lower expectations of the cash that is going to flow to those with property and contract rights to the fruits of capital in the future. Such news drives changes in expectations that are a second source of fluctuations in global capital wealth.
  3. Default Discount: Not all the deeds and contracts will turn out to be worth what they promise or indeed even the paper that they are written on. Fluctuations in the degree to which future payments will fall short of present commitments are a third source of fluctuations in global capital wealth.
  4. Liquidity Discount: The cash flowing to capital arrives in the present rather than the future, and people prefer — to varying degrees at different times — the bird in the hand to the one in the bush that will arrive in hand next year. Fluctuations in this liquidity discount are yet a fourth source of fluctuations in global capital wealth.
  5. Risk Discount: Even holding constant the expected value and the date at which the cash will arrive, people prefer certainty to uncertainty. A risky cash flow with both upside and downside is worth less than a certain cash flow by an amount that depends on global risk tolerance. Fluctuations in global risk tolerance are the fifth and final source of fluctuations in global capital wealth.

In the past two years the wealth that is the global capital stock has fallen in value from $80 trillion to $60 trillion. Savings has not fallen through the floor. We have had little or no bad news about resource constraints, technological opportunities, or political arrangements. Thus (1) and (2) have not been operating. The action has all been in (3), (4), and (5).

As far as (3) is concerned, the recognition that a lot of people are not going to pay their mortgages and thus that a lot of holders of CDOs, MBSs, and counterparties, creditors, and shareholders of financial institutions with mortgage-related assets has increased the default discount by $2 trillion. And the fact that the financial crisis has brought on a recession has further increased the default discount — bond coupons that won’t be paid and stock dividends that won’t live up to firm promises — by a further $4 trillion. So we have a $6 trillion increase in the magnitude of (3) the default discount. The problem is that we have a $20 trillion decline in market values.

Some people have criticised Brad for his characterisation of the liquidity discount, suggesting that he has confused it with the (pure) rate of time preference.  I don’t think he is confused.  Firstly because he’s a genuine expert in the field and if he’s confused,  we’re in big trouble; and secondly because the two concepts are interlinked.

The liquidity discount is that an inability to readily buy or sell an asset – typically evidenced by low trading volumes and a large bid/ask spread – reduces it’s value.

The pure rate of time preference is a measure of impatience.  $1 today is preferred over $1 tomorrow even if there is no inflation. [Update: see below]

The two are linked because if you want to sell assets in an illiquid market, you can either sell them at a huge discount immediately or sell them gradually over time.  The liquidity discount is (presumably) therefore a monotonically increasing function of the pure rate of time preference for a given level of liquidity.

Minor update:

A more correct illustration of the pure rate of time preference would be to say:

Suppose that you could get a guaranteed (i.e. risk-free) annual rate of return of 4% and there is no inflation.  A positive pure rate of time preference says that $1 today is preferred over $1.04 in a year’s time.

Perspective

Everybody’s wringing their hands over the fact that the US economy suffered a net loss of 533,000 jobs in November.  That’s an awful lot and it’s gotta hurt.  Most media outlets are also observing that it’s the worst month for employment since 1974.  Here is the Wall Street Journal:

The U.S. lost half a million jobs in November, the largest one-month drop since 1974, as employers brace for a recession that’s expected to stretch through much of 2009.

The New York Times:

The nation’s employers cut 533,000 jobs in November, the Bureau of Labor Statistics reported Friday.

Not since December 1974, toward the end of a severe recession, have so many jobs disappeared in a single month — and the current recession, far from ending, appears to be just gathering steam.

These facts are true, but they’re also misleading.  There are two important things that nobody that I can see is mentioning:

Firstly, the population of the USA has grown by over 43% in the last 34 years.  In 1974 the resident population was 213 million.  Today it is 306 million [source].  Losing half a million jobs in 1974 was a much bigger event than it is today.

Secondly, a much greater share of households only had one source of income in 1974 compared to today.  Back then, if the sole worker lost their job, the family was in serious trouble.  Today, if one of the (more often than not) two workers in a household loses their job, the family still suffers but far less than they would have back then.

Both of those will be cold comfort to anyone losing their job, but when watching events at a macroscopic level – looking at the country as a whole – it’s important to keep some perspective.

As a side note:  The entry of women into the workforce will have served to reduce at least the scale, if not the likelihood, of a catostrophic loss of income to a household in the sense of Carroll (QJE 1997) (the paper is downloadable here).  What work has been done investigating the links between female participation rates (or, more generally, the number of workers per household) and the extent of buffer-stock saving?

Update:

Paul Krugman looks at the ratio of employed people to total population:

Calculated Risk looks at the Year-over-Year percentage change in employment.

You’ll note, though, that they are both bloggers and not mainstream media.

The sky is blue …

… news at eleven.

The National Bureau of Economic Research (NBER), the official business-cycle dating body for the U.S., has declared that the United States is in a recession and that it started in December 2007.

The data were a little confusing in calling the timing.  Gross Domestic Product (GDP) and Gross Domestic Income (GDI) are two sides of the same coin.  Figures regarding their levels and growth rates ought to be the same and differ only because of statistical (i.e. counting) errors.  From the formal release:

The committee believes that the two most reliable comprehensive estimates of aggregate domestic production are normally the quarterly estimate of real Gross Domestic Product and the quarterly estimate of real Gross Domestic Income, both produced by the Bureau of Economic Analysis. In concept, the two should be the same, because sales of products generate income for producers and workers equal to the value of the sales. However, because the measurement on the product and income sides proceeds somewhat independently, the two actual measures differ by a statistical discrepancy. The product-side estimates fell slightly in 2007Q4, rose slightly in 2008Q1, rose again in 2008Q2, and fell slightly in 2008Q3. The income-side estimates reached their peak in 2007Q3, fell slightly in 2007Q4 and 2008Q1, rose slightly in 2008Q2 to a level below its peak in 2007Q3, and fell again in 2008Q3. Thus, the currently available estimates of quarterly aggregate real domestic production do not speak clearly about the date of a peak in activity.

The brief respite in the middle of 2008 appears to be the result of the first fiscal stimulus package.  Nevertheless, it seems quite clear that the overall trend has been downward.

The committee declared December 2007 as the peak after looking at payroll (i.e. employment) data:

Payroll employment, the number of filled jobs in the economy based on the Bureau of Labor Statistics’ large survey of employers, reached a peak in December 2007 and has declined in every month since then. An alternative measure of employment, measured by the BLS’s household survey, reached a peak in November 2007, declined early in 2008, expanded temporarily in April to a level below its November 2007 peak, and has declined in every month since April 2008.

… and personal income (less transfer payments):

Our measure of real personal income less transfers peaked in December 2007, displayed a zig-zag pattern from then until June 2008 at levels slightly below the December 2007 peak, and has generally declined since June.

… and real manufacturing and wholesale-retail trade sales:

Real manufacturing and wholesale-retail trade sales reached a well-defined peak in June 2008.

… and the Federal Reserve Board’s index of industrial production:

This measure has quite restricted coverage—it includes manufacturing, mining, and utilities but excludes all services and government. Industrial production peaked in January 2008, fell through May 2008, rose slightly in June and July, and then fell substantially from July to September. It rose somewhat in October with the resumption of oil production disturbed by hurricanes in the previous month. The October value of the industrial production index remained a substantial 4.7 percent below its value in January 2008.

The only really interesting thing in all of this to me is to observe that the first fiscal stimulus and the corresponding positive growth in 2008:Q2 saved some embarrassment for the Republican Party.  The negative 2008:Q3 figures were only released on the 25th of November, three weeks after the U.S. election.  Had the 2008:Q2 figures been even faintly negative, there may have been considerable (and, I think, reasonable) pressure for the recession to have been formally recognised in the middle of the campaign.

Why Obama chose Hillary for State

I like both of these answers:

Tyler Cowen:

This is exactly the kind of detailed political question I don’t follow so let’s try some crude, fact-poor economism. Hillary Clinton commands the loyalties of significant segments of the Democratic Party. The implication is that Obama will need these segments for what he is trying to do. Since Obama already has 58 (?) Democratic Senators on his side, we should conclude that Obama will try to do lots in the first few months of his term; this is the “throw long and deep” scenario.

He can always encourage her to leave later, if the relationship does not work out. Latinos, on the other hand, are stronger as voters than as a lobby or as an organized segment of the Democratic Party. The implication is that they will get relatively little at the beginning of Obama’s term — when lobbies are needed — but successively more as the next election approaches.

Andrew Sullivan:

Earlier this year, it seemed a good idea to plonk her on the ticket to defang the threat. That would have followed the “team of rivals” concept that Obama wanted to purloin from Lincoln. It would also have given the Clintons an independent claim on power. By winning without them and even, in some measure, despite them, Obama can now bring the Clintons into the power structure while retaining clear dominance. The State Department appointment is prestigious enough not to be condescending, yet also keeps Clinton off the Washington circuit more than any other position. She’ll be on a plane or abroad a great deal. Extra bonus: Bill will just love that. Sending his wife to the Middle East is the ex-president’s idea of a good time.

There’s also the small question of Iraq. Think of the appointment this way: “You voted for this bloody war, Hillary; you can end it.”

Withdrawing from Iraq will not be easy and it may well be gruesome. I have no confidence that the place won’t erupt into an even nastier civil war when the United States pulls out than it did when the United States didn’t fully push in. How does a president avoid the domestic blow-back of essentially cutting his losses on a doomed adventure? He uses Clinton as a protective shield from domestic critics. It’s also a rather brilliant manoeuvre against those elements on the right – from Fox News to Washington neocons – who came out in praise of Clinton in the spring when she sounded more hawkish than Obama on the Middle East. Having hailed Clinton as the Iron Lady of the Jews, the stab-in-the-back right will find it hard to pivot immediately and accuse her of treason if and when she ends the Iraq occupation.

But why did Hillary accept the job?

The best I can imagine off the top of my head is that (a) she really believes that the Obama presidency will be a successful one; and (b) a successful stint as Secretary of State after time in the Senate would look very, very good on the resume in eight years time.

Oops …

Well, what do you know?  The US government is (almost certainly) going to buy troubled assets after all, starting with those of Citigroup.  CalculatedRisk has been on top of it [1,2,3,4].  The last of those links contains the joint statement by the Treasury, Federal Reserve and FDIC:

As part of the agreement, Treasury and the Federal Deposit Insurance Corporation will provide protection against the possibility of unusually large losses on an asset pool of approximately $306 billion of loans and securities backed by residential and commercial real estate and other such assets, which will remain on Citigroup’s balance sheet. As a fee for this arrangement, Citigroup will issue preferred shares to the Treasury and FDIC. In addition and if necessary, the Federal Reserve stands ready to backstop residual risk in the asset pool through a non-recourse loan.

In addition, Treasury will invest $20 billion in Citigroup from the Troubled Asset Relief Program in exchange for preferred stock with an 8% dividend to the Treasury. Citigroup will comply with enhanced executive compensation restrictions and implement the FDIC’s mortgage modification program.

Here is a summary of the terms of the deal, with a fraction more detail:

Size: Up to $306 bn in assets to be guaranteed (based on valuation agreed upon between institution and USG).

Deductible: Institution absorbs all losses in portfolio up to $29 bn (in addition to existing reserves) Any losses in portfolio in excess of that amount are shared USG (90%) and institution (10%).

USG share will be allocated as follows:
UST (via TARP) second loss up to $5 bn;
FDIC takes the third loss up to $10 bn;

Financing: Federal Reserve funds remaining pool of assets with a non-recourse loan, subject to the institution’s 10% loss sharing, at a floating rate of OIS plus 300bp. Interest payments are with recourse to the institution.

A couple of points:

  • The US government isn’t immediately buying US$306 billion of crappy assets.  It’s guaranteeing that the value of them won’t fall too much further.  If they do, then they’ll buy ’em.  It will be interesting to see how much of this guarantee is actually called into force.
  • Notice that only US$20 billion is attributable to TARP, while the rest is entirely new.  That is presumably to make sure that the US government can continue to stand by it’s recent promise to not ask for congressional approval for the last US$350 billion available under that program.  On the other hand, I suppose it’s also likely that they want to keep the TARP money for direct capital infusions; that is, for actual money spent now rather than taking on risk.
  • To put the US$20 billion of new money into perspective, Citigroup’s market capitalisation as of Friday was US$20.5 billion.
  • It’s that “on valuation agreed upon between institution and USG” that troubles me.  Part of the reasoning given for TARP in the first place was for “price discovery” (through reverse auctions).  There was plenty of criticism of that policy, but the goal of discovering the true value of all of these assets is a noble one.  This bailout of Citi will now involve private negotiation between Citigroup and the US government to determine their value for the purposes of the guarantee.  That’s a bloody awful way to do it.

More on the Effective Funds Rate versus the Target Rate

Without comment, here are some more links on the gap between the target and effective federal funds rates:

Bush does the right thing

The US$700 billion Troubled Asset Relief Program, otherwise known as the mother of all pork, did have one redeeming feature:  It came in tranches.  The first US$350 billion were directly accessible (some of it needed a signature from the president), but the last US$350 billion needs congressional approval.  With just 10 weeks to go in his Presidency and every company big enough to hire a lobbiest bashing on the doors for a piece of the action, George W. Bush has done the right thing:  He’s deciced to not ask for the last 350.  If soon-to-be-President Obama wants to tap it, it’s up to him.

The Bush administration told congressional aides it won’t ask lawmakers to release $350 billion remaining as part of the $700 billion U.S. financial- rescue package, people familiar with the matter said.

The Treasury Department has committed $290 billion, or about 83 percent of the total allocated so far in a program Congress enacted last month to inject capital into a wide spectrum of banks and American International Group Inc. The U.S. invested $125 billion in nine major banks, including Citigroup Inc. and Wells Fargo & Co. and plans to buy an additional $125 billion in preferred shares of smaller lenders.

Paulson told the Wall Street Journal today he is unlikely to use what remains of the package, estimated at $410 billion, unless a need arises.

“I’m not going to be looking to start up new things unless they’re necessary, unless they make great sense,” Paulson said. “I want to preserve the firepower, the flexibility we have now and those that come after us will have.”

Update: I don’t mean to suggest that the money shouldn’t be spent. Maybe it should. Professor Krugman, for one, might argue that it ought to be spent as part of a stimulus package. I just think that it’s correct for Bush to pass on deciding how to spend it. His moral authority as an economic leader was gone some time ago. Paulson’s flip-flopping, even if what he has moved to is the better plan, demonstrates the same for him. America will – I suspect – benefit from being forced to take a breather in their cries for help. Let the new team think about the whole mess carefully and then take up the responsibility handed to them.

Another update: The anonymous authors at Free Exchange aren’t so sure it’s a good idea:

It is, in effect, calling time-out on the rescue until Barack Obama is sworn in, and even then there will be a delay while funds are requested and authorised. Meanwhile, Congress has all but decided not to pursue a stimulus bill during the lame duck session. The legislature is taking up discussions on an automaker bail-out, but given resistance to a rescue among Republicans and conservative Democrats, it seems clear that any bill signed into law during the lame duck will be quite weak.

Now, Ben Bernanke will remain on duty right through the inauguration. There’s still an executive branch, and there are still plenty of international policy makers working to stabilise the global financial system. But in a very real sense, America is going to coast on its current economic policies for the next two (and in practice, three) months. I’m not sure this is a good idea, particularly given the critical nature of the holiday shopping season. By all accounts, consumers are locking up their piggy banks at the moment. A disastrous shopping season will probably mean a wave of post-holiday failures among retailers, which will, in turn, mean lay-offs (as well as pain for exporters to America).

Yes, it’s only three months, but three months is a long time for people and businesses struggling to pay bills. And if the economic situation deteriorates over that span, then the government may well feel pressured to pass a much larger and more expensive stimulus package in the spring.

I’m not convinced.  I do note that, as Paul Krugman points out, it’s difficult to have too large a fiscal stimulus in this environment.  I also think that we might benefit from backing off a little bit and abandoning the idea that America and the world at large can somehow escape the recession.  It needs to sink in.

Is there $100 lying on the ground? (Updated)

There’s an old joke among economists:  Two economists are walking along when one of them notices $100 lying on the ground and bends over to pick it up.  The other one says: “Don’t bother.  If there were really $100 on the ground, someone would already have taken it.”  It’s about things like the Efficient Market Hypothesis and the Coase Theorem.  In short, that opportunities for arbitrage ought to disappear quite quickly because their existence represents free money. [1]

James Hamilton is wondering if he’s staring at $100 lying on the floor of the US Federal Reserve.

On the 5th of November, the US Fed announced that starting on the 6th, any depository institution (e.g. a regular bank) with reserves at the fed would be paid the Federal Funds Target Rate (which is what gets splashed all over the news) on both required and excess reserves.[2]  On the face of it, that would appear to set the target rate as a floor for inter-bank lending.  Why would any bank lend money to another bank for less than the target rate and a little bit of risk when they could put the money in their federal reserve account to get the target rate with no risk?

The mystery, then, is why the effective rate (a volume-weighted average of actual lending rates) really is below the target rate:

The latest data at the time of my writing this was for the 7th of November.  The effective rate was 0.27% while the target rate was 1.00%.

At first, James thought that the reason must be the 75 basis-point charge made by the Federal Deposit Insurance Corporation (FDIC) for guaranteeing the repayment of any federal funds borrowed, but then he realised that the charge doesn’t apply to any borrowing made before the 13th of November.

So we’re still left with the mystery.

It’s probably got something to do with the non-depository institutions that play in the fed funds market (e.g. the G.S.E.s like Fannie Mae and Freddie Mac).  Those institutions don’t receive any interest on cash held at the Federal Reserve, so if they want to make a return on it they need to lend it out.  But why aren’t the depository institutions snapping it up?  They can borrow from a G.S.E. at 0.27%, put it in their reserve account with the fed and get 1%. Since the FDIC has waived all charges for guaranteeing fed fund borrowing until the 13th of November, it’s also risk-free at no extra cost.

[1] The joke also says something about economists:  That we need to make up jokes about other economists is pretty sad. 🙂

[2] Strictly speaking, the rate paid on excess reserves is the minimum target rate over a two-week period, but since it’s (reasonably) safe to assume that the Fed won’t lower rates again in the next week, we can operate as above.

Update: The only idea that I can come up with sounds like a conspiracy theory (and I therefore consider it highly unlikely): that fund managers at the G.S.E.s are not seeking the best rate of return for their cash, but instead voluntarily accepting a return well below the target rate.  Since Fannie and Freddie are 79.9% U.S. government-owned now, what are the odds that there is a depository bank out there that is struggling mightily and the government is using its control of the G.S.E.s to give that bank free money?

History of US Legislative and Executive power (again)

Ages ago, I wrote briefly about the history of US legislative and executive power.  I thought I’d update it now that the latest election has (pretty much) settled.  Between 1901 and 2010, the Democratic Party will have been in power in the House of Representatives 65.5% of the time, in the Senate 58.2% of the time and had the presidency 50% of the time.

Much more interestingly, Americans seem to prefer having the same party control all three branches of US government at the same time.  While pure chance would put such an occurrence at 25% (i.e. two out of eight possible configurations), it actually occurred over 61% of the time (33 congresses out of 54).  Of those 33, 21 were all-Democrat and 12 were all-Republican.

Click on the image below to go through to an excel spreadsheet with the details:

History of US legislative and executive power (1901-2010)

More on the shift from Republican to Democrat

Brad Delong observes that there is a clear regional exception to the idea of a broad shift in the vote from the Republicans to the Democrats (the original scatterplot comes from Andrew Gelman):

Paul Krugman takes it a bit further, emphasising this beauty of a map (I’m not sure of the source.  Probably the NY Times?):

The shifts to the Republicans in Arizona and Alaska and to the Democrats in Illinois and Delaware are clearly down to the candidates coming from those states.  I’m a little surprised at the strength of the Republican shift in southern Louisiana.  One might have thought that with the memory of Hurricane Katrina they would have moved blue.  Perhaps the administration’s management of Hurricane Gustav was seen as successful?  The Oklahoma-Arkansas-Tennessee shift is presumably McCain’s “real America.”  I’d love to see a demographic breakdown of the vote in those states.

Almost immediate update:

dbt on Brad Delong’s blog points out the obvious about Louisiana:

Don’t lump Louisiana into that. The changes there are demographic, not electoral.

Which of course must be the explanation. Southern Louisiana didn’t turn red because of the success of the handling of Gustav; it turned red because of the failure to handle Katrina – vast numbers of black Americans were forced out and haven’t come back.