History of US Legislative and Executive power (again)

Ages ago, I wrote briefly about the history of US legislative and executive power.  I thought I’d update it now that the latest election has (pretty much) settled.  Between 1901 and 2010, the Democratic Party will have been in power in the House of Representatives 65.5% of the time, in the Senate 58.2% of the time and had the presidency 50% of the time.

Much more interestingly, Americans seem to prefer having the same party control all three branches of US government at the same time.  While pure chance would put such an occurrence at 25% (i.e. two out of eight possible configurations), it actually occurred over 61% of the time (33 congresses out of 54).  Of those 33, 21 were all-Democrat and 12 were all-Republican.

Click on the image below to go through to an excel spreadsheet with the details:
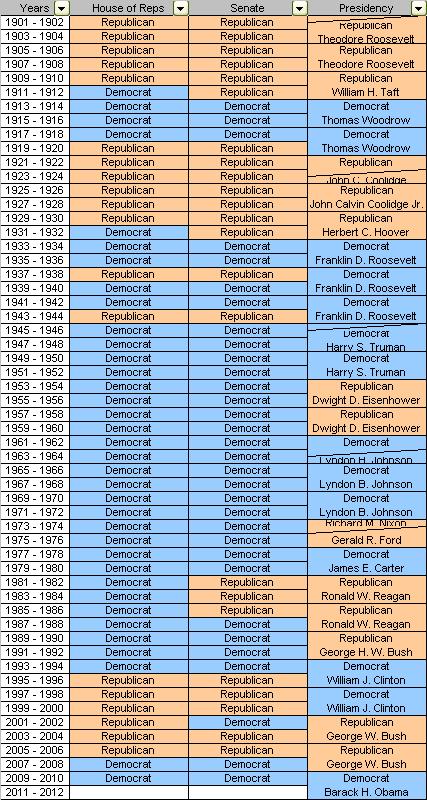
History of US legislative and executive power (1901-2010)

More on the shift from Republican to Democrat

Brad Delong observes that there is a clear regional exception to the idea of a broad shift in the vote from the Republicans to the Democrats (the original scatterplot comes from Andrew Gelman):

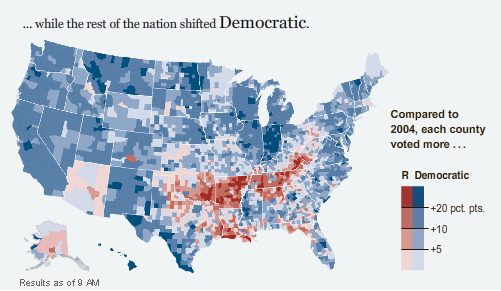
Paul Krugman takes it a bit further, emphasising this beauty of a map (I’m not sure of the source.  Probably the NY Times?):

The shifts to the Republicans in Arizona and Alaska and to the Democrats in Illinois and Delaware are clearly down to the candidates coming from those states.  I’m a little surprised at the strength of the Republican shift in southern Louisiana.  One might have thought that with the memory of Hurricane Katrina they would have moved blue.  Perhaps the administration’s management of Hurricane Gustav was seen as successful?  The Oklahoma-Arkansas-Tennessee shift is presumably McCain’s “real America.”  I’d love to see a demographic breakdown of the vote in those states.

Almost immediate update:

dbt on Brad Delong’s blog points out the obvious about Louisiana:

Don’t lump Louisiana into that. The changes there are demographic, not electoral.

Which of course must be the explanation. Southern Louisiana didn’t turn red because of the success of the handling of Gustav; it turned red because of the failure to handle Katrina – vast numbers of black Americans were forced out and haven’t come back.

Sarah Palin: the unholy love child of George W. Bush and Pauline Hansen

Sarah Palin did not know the countries in NAFTA, nor that Africa is a continent, not a country.

I’m with Andrew Sullivan on this one:

Now all I want to say here, ahem, is that they realized all this about this person within a few days of picking her and yet they went ahead for two months bullshitting us … and risking the live possibility that she could be president of the United States at a moment’s notice after next January.

You know: I took a lot of grief for my pretty instant realization back in August that the Palin candidacy was a total farce. But when you cop to the fact that the McCain peeps knew most of that too very early on after their world-historical screw-up, you’ve got to respect and be terrified by their cynicism. I mean: country first?

And they only lost by a few points?

What I find incredible is that people are talking about Sarah Palin as a new leader within the Republican party.  Why?

US 2008 Presidential Election Breakdown

Andrew Gelman, who writes at Statistical modeling, has a quick summary of what took place over on his redbluerichpoor site.  The two take-away thoughts for me:

1) The red state/blue state divisions haven’t been redrawn.  There was simply a general shift across the board away from the Republicans and towards the Democrats:

Update: See also More on the shift from Republican to Democrat.

2) Nate Silver, at fivethirtyeight.com, did a pretty good job of aggregating the polls to predict what would happen, at least for those states in the middle:

I’ll leave the question over whether Nate’s aggregation technique was optimal to the experts.

Georgia Senate race – it looks like a runoff

In the U.S. state of Georgia, senate races have a crude form of preferential voting:  if no candidate secures 50% of the vote, the top two candidates go into a runoff election.  It looks like that may be about to happen:

With 99 percent of precincts reporting early Wednesday afternoon, Chambliss [incumbent, Republican] had 1,841,449 votes, or 49.9 percent of the total, while Martin [Democrat] had 1,727,625 votes, or 47 percent. Libertarian Allen Buckley had 126,328 votes, or 3 percent.

It’s by no means certain – there are some 200,000 more votes to count and the whole thing needs to be certified – but if Chambliss stays below the 50% line, we could be about to have some (more) fun.

Given the visual scale of the Obama victory, it seems safe to assume that Martin would do better in the runoff.  A Martin victory would not give the Democrats the supermajority of 60 seats in the US Senate, even with the two independents, but it is nothing to be sneezed at and it’s safe to assume that if the runoff goes ahead the president-elect will be visiting Georgia in the next few weeks.

The scale of campaign finance in the US election

I’ve spoken before about how the sheer scale of the Obama campaign will give Republicans something to hide behind instead of doing some serious soul searching.

The NY Times has great graphic showing the campaigns’ finance by area and week.  The totals:

Obama:  $659.7 M

Clinton: $249.0 M

McCain: $238.1 M

Romney: $113.6 M

Giuliani: $65.9 M

Edwards: $62.2 M

Paul: $35.1 M

Yes, that’s right – Hillary Clinton raised more money than McCain and Obama more than Clinton, McCain and Romney combined.  Incredible.

… Or is it?

David Strömberg, writing over at Vox EU, observes:

Without the Bradley effect, Obama has an 84% chance of winning, receiving 52% of the two-party vote share. (Obama is expected to receive 52% even though he is polling at 53% of the two-party vote share, because of the catch-up effect.) However, the race is a coin flip if the presidential race will exhibit a Bradley effect of the same size as the average for the 22 House, Senate and Governor races 1998-2006 for which I have data. Obama’s win probability drops to 53%, with an expected vote share of 49.9

Bugger me, that’s depressing.  Transcend, dammit, transcend!

When can social change occur?

Somebody much smarter than I am was kind enough to read my little post on Endogenous Growth Theory.  At lunch today, they drew attention to this item that I mentioned:

I’m not aware of anything that tries to model the emergence of ground-breaking discoveries that change the way that the economy works (flight, computers) rather than simply new types of product (iPhone) or improved versions of existing products (iPhone 3G). In essence, it seems important to me that a model of growth include the concept of infrastructure.

The question was raised:

Could it be that times of significant social change have a tendency to coincide with with the introduction (i.e. either the invention or the adoption) of new forms of infrastructure? [*]  A new type of mobile phone hardly changes the world, but the wide-spread adoption of mobile telephony in a country certainly might change the social dynamic in that country.

It’s something to ponder …

[*] My intelligent friend is not an economist and would probably prefer to think of this as a groundbreaking discovery rather than just the development of a new type of infrastructure.