How to value toxic assets (part 4)

Okay.  First, a correction:  There is (of course) a market for CDOs and other such derivatives at the moment.  You can sell them if you want.  It’s just that the prices that buyers are willing to pay is below what the holders of CDOs are willing to accept.

So, here are a few thoughts on estimating the underlying, or “fair,” value of a CDO:

Method 1. Standard asset pricing considers an asset’s value to be the sum of the present discounted value of all future income that it generates.  We discount future income because:

  • Inflation will mean that the money will be worth less in the future, so in terms of purchasing power, we should discount it when thinking of it in today’s terms.
  • Even if there were no inflation, if we got the money today we could invest it elsewhere, so we need to discount future income to allow for the (lost) opportunity cost if current investment options generate a higher return than what the asset is giving us.
  • Even if there were no inflation and no opportunity cost, there is a risk that we won’t receive the future money.  This is the big one when it comes to valuing CDOs and the like.
  • Even if there’s no inflation, no opportunity cost and no risk of not being paid, a positive pure rate of time preference means that we’d still prefer to get our money today.

The discounting due to the risk of non-payment is difficult to quantify because of the opacity of CDOs.  The holders of CDOs don’t know exactly which mortgages are at the base of their particular derivative structure and even if they did, they don’t know the household income of each of those borrowers.  Originally, they simply trusted the ratings agencies, believing that something labeled “AAA” would miss payment with probability p%, something “AA” with probability q% and so on.  Now that the ratings handed out have been shown to be so wildly inappropriate, investors in CDOs are being forced to come up with new numbers.  This is where Knightian Uncertainty is coming into effect:  Since even the risk is uncertain, we are in the Rumsfeldian realm of unknown unknowns.

Of course we do know some things about the risk of non-payment.  It obviously rises as the amount of equity a homeowner has falls and rises especially quickly when they are underwater (a.k.a. have negative equity (a.k.a. they owe more than the property is worth)).  It also obviously rises if there have been a lot of people laid off from their jobs recently (remember that the owner of a CDO can’t see exactly who lies at the base of the structure, so they need to think about the probability that whoever it is just lost their job).

The first of those is the point behind this idea from Chris Carroll out of NYU:  perhaps the US Fed should simply offer insurance against falls in US house prices.

The second of those will be partially addressed in the future by this policy change announced recently by the Federal Housing Finance Agency:

[E]ffective with mortgage applications taken on or after Jan. 1, 2010, Freddie Mac and Fannie Mae are required to obtain loan-level identifiers for the loan originator, loan origination company, field appraiser and supervisory appraiser … With enactment of the S.A.F.E. Mortgage Licensing Act, identifiers will now be available for each individual loan originator.

“This represents a major industry change. Requiring identifiers allows the Enterprises to identify loan originators and appraisers at the loan-level, and to monitor performance and trends of their loans,” said Lockhart [, director of the FHFA].

It’s only for things bought by Fannie and Freddie and it’s only for future loans, but hopefully this will help eventually.

Method 2. The value of different assets will often necessarily covary.  As a absurdly simple example, the values of the AAA-rated and A-rated tranches of a CDO offering must provide upper and lower bounds on the value of the corresponding AA-rated tranche.  Statistical estimation techniques might therefore be used to infer an asset’s value.  This is the work of quantitative analysts, or “quants.”

Of course, this sort of analysis will suffer as the quality of the inputs falls, so if some CDOs have been valued by looking at other CDOs and none of them are currently trading (or the prices of those trades are different to the true values), then the value of this analysis correspondingly falls.

Method 3. Borrowing from Michael Pomerleano’s comment in rely to Christopher Carroll’s piece, one extreme method of valuing CDOs is to ask at what price a distressed debt (a.k.a. vulture) fund would be willing to buy them at with the intention of merging all the CDOs and other MBSs for a given mortgage pool so that they could then renegotiate the debt with the underlying borrowers (the people who took out the mortgages in the first place).  This is, in essense, a job of putting Humpty Dumpty back together again.  Gathering all the CDOs and other MBSs for a given pool of mortgage assets will take time.  Identifying precisely those mortgage assets will also take time.  There will be sizable legal costs.  Some holders of the lower-rated CDOs may also refuse to sell if they realise what’s happening, hoping to draw out some rent extraction from the fund.  The price that the vulture fund would offer on even the “highly” rated CDOs would therefore be very low in order to ensure that they made a profit.

It would appear that banks and other holders of CDOs and the like are using some combination of methods one and two to value their assets, while the bid-prices being offered by buyers are being set by the logic of something like method three.  Presumably then, if we knew the banks’ private valuations, we might regard the difference between them and the market prices as the value of the uncertainty.
Other posts in this series:  1, 2, 3, [4], 5, 6.

The fiscal multiplier

This is mostly for my EC102 students.  There’s been some argument in the academic economist blogosphere over the size of the fiscal multiplier in the USA.  The fiscal multiplier is a measure of by how much GDP rises for an extra dollar of government spending.  There are several main forces in determining it’s size:

  • The Marginal Propensity to Consume (MPC) determines the upper limit of the multiplier.  Suppose that for each extra dollar of income, we tend to spend 60 cents in consumption.  Because the economy is a massive, whirling recycling of money – I spend a dollar in your shop, you save 40 cents and spend 60 cents in the second shop, the guy in the second shop pockets 40% of that and spends the rest in the third shop and so on – one dollar of government spending might produce 1+ 0.6 + 0.6^2 + 0.6^3 + … = 1 / (1 – 0.6) = 2.5 dollars of GDP.
  • The extra government spending needs to be paid for, which means that taxes will need to go up.  For it to be a stimulus now, it’ll typically be financed through borrowing instead of raising taxes now (i.e. taxes will go up later).  If people recognise that fact, they may instead choose to consume less and save more in anticipation of that future tax bill, therefore lowering the multiplier.  If it gets to a point where there is no difference between raising-taxes-now and borrowing-now-and-raising-taxes-later, we have Ricardian equivalence.
  • If the extra government spending is paid for by borrowing, that will raise interest rates (Interest rates and the price of bonds move in opposite directions – by selling more bonds, the government will be increasing their supply and thus lowering their price; hence, the interest rate will rise).  If the interest rate goes up, that makes it more expensive for private businesses to borrow, which means that private investment will go down.  This is the crowding-out effect.  Since GDP = Consumption + Private Investment + Government spending + Net exports, this will lower the multiplier as well.
  • The size of the multiplier will also depend on the size of the extra government spending.  Generally speaking, the multiplier will be smaller for the second extra dollar spent than for the first and smaller again for the third.  That is, increasing government spending exhibits decreasing marginal returns.  This is because the second and third points listed above will become more and more relevant for larger and larger amounts of extra government spending.
  • Everything gets more complicated when you start to look at current tax rates as well. An alternative to a debt-funded expansion in spending is a debt-funded reduction in revenue (i.e. a tax cut). The multiplier can be very different between those two circumstances.
  • Then we have what is arguably the most important part: where the extra spending (or the tax cut) is directed. Poor people have a much higher marginal propensity to consume than rich people, so if you want to increase government spending, you should target the poor to get a larger multiplier. Alternatively, cutting taxes associated with an increase in a business (e.g. payroll taxes) will lower the cost of that increase and produce a larger multiplier than a tax-cut for work that was already happening anyway.
  • Next, it is important to note that everything above varies depending on where we are in the business cycle.  For example, the crowding-out effect will be strongest (i.e. worst) when the economy is near full employment and be weakest (i.e. less of a problem) when the economy is in recession.
  • Finally, we have the progressivity of the tax system.  This won’t really affect the size of the multiplier directly, but it is important that you think about it. Rich people pay more tax than poor people, not just in absolute levels (which is obvious), but also as a fraction of their income. That means that the burden of paying back the government debt will fall more on the shoulders of the rich, even after you take into account the fact that they earn more.

Much of what you’ll read arguing for or against a stimulus package will fail to take all of those into account.  People are often defending their personal views on the ideal size of government and so tend to pick-and-choose between the various effects in support of their view.

How to value toxic assets (part 3)

Continuing on from my previous thoughts (1, 2, 3, 4) …

In the world of accounting, the relevant phrase here is “fair value.”  In the United States (which presently uses a different set of accounting requirements to the rest of the world, although that is changing), assets are classified as being in one of three levels (I’m largely reproducing the Wikipedia article here):

Level one assets are those traded in liquid markets with quoted prices.  Fair value (in a mark-to-market sense) is taken to be the current price.

Level two and level three assets are not traded in liquid markets with quoted prices, so their fair values need to be estimated via a statistical model.

Level two assets are those whose fair value is able to be estimated by looking at publicly-available market information.  As a contrived example, maybe there is currently no market for a particular AA-rated tranche of CDOs, but there are recent prices for the corresponding AAA-rated and A-rated tranches, so the AA-rated stuff should be valued somewhere in between those two.

Level three assets are those whose fair value can only be estimated by appealing to information that is not publicly observable.

These are listed in the U.S. Financial Accounting Standards Board (FASB) Statement 157.  In October of last year, the FASB issued some clarification/guidance on valuing derivatives like CDOs when the market for them had dried up.

Brad DeLong, in early December last year, was given a list of reasons from Steve Ross why we might not want to always mark-to-market (i.e. assume that the fair value is the currently available market price):

  • If you believe in organizational capital–in goodwill–in the value of the enterprise’s skills, knowledge, and relationships as a source of future cash flows–than marking it to market as if that organizational capital had no value is the wrong thing to do.
    • Especially as times in which asset values are disturbed and impaired are likely to be times when the value of that organizational capital is highest.
  • If you believe in mean reversion in risk-adjusted asset values, mark-to-market accounting is the wrong thing to do.
  • If you believe that transaction prices differ from risk-adjusted asset values–perhaps because transaction prices are of particular assets that are or are feared to be adversely selected and hence are not representative of the asset class–than mark-to-market accounting is the wrong thing to do.
  • If you believe that changes in risk-adjusted asset values are unpredictable, but also believe:
    • in time-varying required expected returns do to changing risk premia;
    • that an entity’s own cost of capital does not necessarily move one-for-one with the market’s time-varying risk premia;
    • then mark-to-market accounting is the wrong thing to do.

Other posts in this series:  1, 2, [3], 4, 5, 6.

How to value toxic assets (part 2)

Continuing on from my previous post on this topic, Paul Krugman has been voicing similar concerns (and far more eloquently).  Although his focus has been on the idea of a bad bank (to which all the regular banks would sell their CDOs and other now-questionable assets), the problems are the same.  On the 17th of January he wrote:

It comes back to the original questions about the TARP. Financial institutions that want to “get bad assets off their balance sheets” can do that any time they like, by writing those assets down to zero — or by selling them at whatever price they can. If we create a new institution to take over those assets, the $700 billion question is, at what price? And I still haven’t seen anything that explains how the price will be determined.

I suspect, though I’m not certain, that policymakers are once more coming around to the view that mortgage-backed securities are being systematically underpriced. But do we really know this? And how are we going to ensure that this doesn’t end up being a huge giveaway to financial firms?

On the 18th of January, he followed this up with:

What people are thinking about, it’s pretty clear, is the Resolution Trust Corporation, which cleaned up the savings and loan mess. That’s a good role model, as far as it goes. But the creation of the RTC did not rescue the S&Ls. The S&Ls were rescued by (1) having FSLIC seize them, cleaning out the stockholders (2) having FSLIC pay down enough debt to make them viable (3) reselling them to new investors. The RTC’s takeover of the bad assets was just a way for taxpayers to reclaim some of the cost of recapitalizing the banks.

What’s being contemplated now, if Sheila Bair’s interview is any indication, is the creation of an RTC-like entity without the rest of the process. The “bad bank” will pay “fair value”, whatever that is, for the assets. But how does that help the situation?

It looks as if we’re back to the idea that toxic waste is really, truly worth much more than anyone is willing to pay for it — and that if only we get the price “right”, the banks will turn out to be solvent after all. In other words, we’re still in Super-SIV territory, the belief that fancy financial engineering can create value out of nothing.

Tyler Cowen points us to this article in the Washington Post that describes the issues pretty well.  Again, the crux of the matter is:

The difficulty is that banks think their assets are worth more than investors are willing to pay. If the government sides with investors, the banks will be forced to swallow the difference as a loss. If the government pays what the banks regard as a fair price, however, the markets may ignore the transactions as a bailout by another name.

Tyler Cowen’s own comment:

If the assets are undervalued by the market, buying them up is an OK deal. Presumably the price would be determined by a reverse auction, with hard-to-track asset heterogeneity introducing some arbitrariness into the resulting prices. If these assets are not undervalued by the market, and indeed they really are worth so little, our government wishes to find a not-fully-transparent way to give financial firms greater value, also known as “huge giveaway.”

Right now it seems to boil down to the original TARP idea or nationalization, take your pick. You are more likely to favor nationalization if you think that governments can run things well, if you feel there is justice in government having “upside” on the deal, and if you are keen to spend the TARP money on other programs instead.

How to value toxic assets

There should really be a question mark at the end of that title.  As far as I can tell, no-one really knows.

I mentioned yesterday that the US government has just given a guarantee to Bank of America against losses in a collection of CDOs and other derrivatives that BofA and the US government agreed were currently worth US$81 billion (the headline guarantee is for $118 billion, but $37 billion of that is cash assets that are unlikely to lose value).

Last November the US government did the same thing for Citigroup, but the numbers there were much larger:  US$306 billion.

The deal with Bank of America is a better one because the $81 billion of toxic assets had to be bundled with $37 billion of cash that will almost certainly create a (small) profit to partially offset any losses.

Nevertheless there is a general question of how they arrived at those numbers given that the market for those assets has dried up:  nobody is buying or selling them, so there aren’t any market prices to use.

The problem is hardly unique to America.  From today’s FT:

[M]inisters and regulators are examining loans already on banks’ balance sheets, which are becoming more impaired as the economy deteriorates. Concern about the eventual size of losses on them is one reason British banks have recently reined in lending.

Final decisions are not expected imminently from the Treasury. But Mr Brown has spoken recently of the problem of “toxic assets” on balance sheets, raising speculation that a “bad bank” solution will be adopted.

The prime minister has also said Britain is looking at different models. These include schemes whereby the government buys up bad assets in return for cash or government bonds; and schemes where banks keep the assets on their balance sheets but the government insures them against loss. The latter method was adopted by the US government this week to shore up Bank of America.

The Bank of England is moving towards the idea of a so-called bad bank, since private sales of bank assets are proving difficult or impossible. But it raises difficult questions: how should assets be valued; should gilts be issued for the purchases; or should money be created.

Mr Darling also notes that a US toxic asset relief scheme proved difficult to launch because of banks’ refusal to sell assets at a price ­acceptable to the government. Offering insurance against future losses on bad assets could prove more attractive.

“The other problem is that the banks haven’t asked us to do this yet,” said one government official. “We would be asking the banks to give us a load of crap and they’d say to us: ‘What are you going to pay us then?’”

The credit crisis will not end until we know which banks are solvent and which are not, and we won’t know that until we know the value of those CDOs.  Despite the fact that they can’t sell them, banks are loath to write them off completely.  Also from the FT today:

With speculation growing that the government will be forced to stage another bank rescue, the prime minister told the Financial Times he had been urging the banks for almost a year to write down their bad assets. “One of the necessary elements for the next stage is for people to have a clear understanding that bad assets have been written off,” he said.

Speaking amid mounting market concerns that banks face further heavy losses, Mr Brown said: “We have got to be clear that where we have got clearly bad assets, I expect them to be dealt with.”

Is it just me, or do you get impression that we’re watching a very expensive game of chicken here?

Ecuador defaults. Wait, no. Yes. Maybe?

Felix Salmon points out the absurdity of the situation:

A couple of major developments on the Ecuador front: yesterday, finance minister Elsa Viteri came out with the rather stunning decision that the country would make the coupon payments on its 2015 global bonds — despite deciding to default on the 2012s and the 2030s. And today, the Ecuador CDS auction closed at 31.375%, meaning that anybody holding an Ecuador CDS will receive 68.625 cents on the dollar.

Viteri’s decision opens up a major legal battle: there’s no doubt that Ecuador’s legions of creditors will attempt to attach those coupon payments the minute they arrive in the US. And I, for one, can’t imagine for a second that holders of the 2012s and the 2030s will take Ecuador up on any forthcoming offer to buy their bonds back at 30 cents on the dollar when the country is happily paying the 2015s in full.

This is not the first time Ecuador has tried to pay some foreign creditors without paying others who are pari passu. Ten years ago it tried a very similar trick with its Brady bonds — with disastrous results. But I don’t think that Ecuador has any grand strategy here; instead, the most likely hypothesis is that a well-connected financier has greased enough palms to make sure that he gets paid out on both his 2015s and his credit default swaps.

What all this means in practice is that Ecuador is now behaving so erratically that there’s no point even attempting to deal or negotiate with the present administration in anything like good faith. Instead, the holders of the 2015s will thank their lucky stars and hope that they actually receive their money; the professional vultures will be spending a lot of time in federal court in lower Manhattan; and most of the rest of the holders of the 2012s and the 2030s will simply wait for the next Ecuadorean president to come along. Because this one just isn’t acting logically.

*sigh*

Hot money and China

Brad Setser (there are lots of pretty graphs on his site):

There is only one way to square a record trade surplus with the sharp fall in reserve growth:

Hot money is now flowing out of China. Here is one way of thinking of it:

The trade surplus should have produced a $115 billion increase in China’s foreign assets. FDI inflows and interest income should combine to produce another $30-40 billion. The fall in the reserve requirement should have added another $50-55 billion (if not more) to China’s reserves. Sum it up and China’s reserves would have increased by about $200 billion in the absence of hot money flows. Instead they went up by about $50 billion. That implies that money is now flowing out of China as fast as it flowed in during the first part of 2008.

And in December, the outflows were absolutely brutal. December reserves were up by $20 billion or so after accounting for valuation changes – but the fall in the reserve requirement alone should have pushed reserves up by at least $25 billion. Throw in a close to $40 billion trade surplus and another $10 billion or so from FDI and interest income, and the small increases in reserves implies $70 billion plus in monthly hot only outflows … That’s huge. Annualized, it is well in excess of 10% of China’s GDP. Probably above 15%.

The mystery being, of course, who is doing the “hot money” transfers.  Chinese companies?  Investors from Taiwan or Hong Kong?  Investors from further abroad? Brad seems to suspect the second:

Over time, if hot money outflows subside, China’s reserve growth should converge to its current account surplus (plus net FDI inflows). That implies ongoing Treasury purchases – though not at the current pace – barring a shift back into “risk” assets. And if hot money outflows continue, watch for Hong Kong and Taiwan to buy more Treasuries. The money flowing out of China doesn’t just disappear … it has to go somewhere.

Individually sub-rational, collectively rational (near equilibrium)

Alex Tabarrok has had an interesting idea.  It’s short enough to quote in its entirety:

Rationality is a property of equilibrium. By this I mean that rationality is habitual and experience-based and it becomes effective as it becomes embedded in the rules of thumb and collective wisdom of market participants. Rules of thumb approximate rational decision rules as market participants become familiar with an economic environment. Individuals per se are not very rational; shift the equilibrium enough so that the old rules of thumb no longer apply and we are likely to see bubbles, manias, panics and crashes. Significant innovation is almost always going to come accompanied with a wave of irrationality. When we shift to a significant, new equilibrium rationality itself is not strong enough to tie down behavior and unmoored by either reason or experience individuals flail about liked naked apes – this is the realm of behavioral economics. Given time, however, new rules of thumb evolve and rationality once again rules but only until the next big innovation arrives.

It seems appealing to me on a first read, but there are plenty of questions to go with it.

There is a language difficulty here.  On one level, an equilibrium is defined by the actions of everybody aggregating to demand and supply in any given instant, so we are always in an equilibrium by definition.  On another level, an equilibrium is a deeper, fundamental attractor that (at least in the short run) exists independently of people’s choices.  In what follows, I will call the first “where we are” and the second “the attractor”.

Why would agents use rules of thumb instead of making decisions on a fully-rational basis?  Is it just because they aren’t entirely rational people (not very satisfying) or are there constraints that induce a fully rational individual to use rules of thumb?

Under what market mechanisms do the individually sub-rational agents aggregate to collectively rational decision-making when we are close to the attractor and – potentially – to collectively irrational decision-making when we are far away from the attractor?

What form of decision rules do the sub-rational (rule of thumb) agents use?  Could we say that agents use taylor-series approximations around the point they believe to be the attractor, with the exact location of the attractor being uncertain?  If so, would it be interesting to imagine that simple agents use first-order (i.e. linear) approximations and sophisticated agents use second-order (quadratic) approximations?

What is the source of uncertainty?  With my example in the previous paragraph, why doesn’t everybody instantly know the new location of the attractor and adjust their rules of thumb accordingly?

How do agents learn?  Could we bypass this question by proposing that agents update their understanding of where the attractor is in a manner analogous to firms setting prices in the Calvo pricing (i.e. a fixed percentage of agents discover the truth in any given period)?

Money multipliers and financial globalisation

Important: Much of this post is mistaken (i.e. wrong).  It’s perfectly possible for America to have an M1 money multiplier of less than one even if they were an entirely closed economy.  My apologies.  I guess that’s what I get for clicking on “Publish” at one in the morning.  A more sensible post should be forthcoming soon.  I’m leaving this here, with all its mistakes, for the sake of completeness and so that people can compare it to my proper post whenever I get around to it.

Update: You can (finally) see the improved post here.  You’ll probably still want to refer back to this one for the graphs.

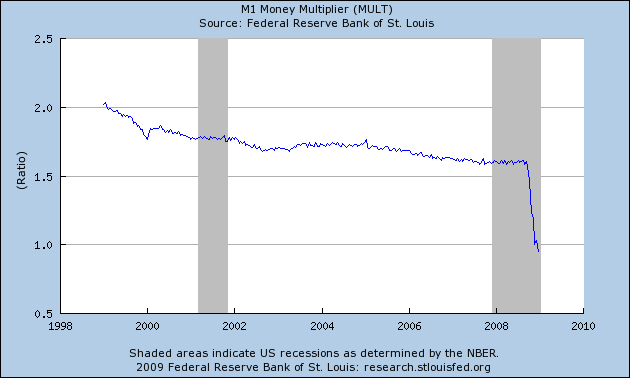
Via Greg Mankiw, I see that in the USA the M1 money multiplier has just fallen below one:

M1 Money Multiplier (USA, Accessed:  7 Jan 2009)
M1 Money Multiplier (USA, Accessed: 7 Jan 2009)

At the time of writing, the latest figure (for 17 December 2008) was 0.954.  That’s fascinating, because it should be impossible.  As far as I can tell, it has been made possible by the wonders of financial globalisation and was triggered by a decision the US Federal Reserve made at the start of October 2008.  More importantly, it means that America is paying to recapitalise some banks in other countries and while that will help them in the long run, it might be exacerbating the recessions in those countries in the short run.

Money is a strange thing.  One might think it would be easy to define (and hence, to count), but there is substantial disagreement of what qualifies as money and every central bank has their own set of definitions.  In America the definitions are (loosely):

  • M0 (the monetary base) = Physical currency in circulation + reserves held at the Federal Reserve
  • M1 = Physical currency in circulation + deposit (e.g. checking) accounts at regular banks
  • M2 = M1 + savings accounts

They aren’t entirely correct (e.g. M1 also includes travelers cheques, M2 also includes time/term deposits, etc.), but they’ll do for the moment [you can see a variety of countries’ definitions on Wikipedia].

The M1 Money Multiplier is the ratio of M1 to M0.  That is, M1 / M0.

In the normal course of events, regular banks’ reserves at the central bank are only a small fraction of the deposits they hold.  The reason is simple:  The central bank doesn’t pay interest on reserves, so they’d much rather invest (i.e. lend) the money elsewhere.  As a result, they only keep in reserve the minimum that they’re required to by law.

We therefore often think of M1 as being defined as:  M1 = M0 + deposits not held in reserve.

You can hopefully see why it should seem impossible for the M1 money multiplier to fall below 1.  M1 / M0 = (M0 + non-reserve deposits) / M0 = 1 + (non-reserve deposits / M0).  Since the non-reserve deposits are always positive, the ratio should always be greater than one.  So why isn’t it?

Step 1 in understanding why is this press release from the Federal Reserve dated 6 October 2008.  Effective from 1 October 2008, the Fed started paying interest on both required and excess reserves that regular banks (what the Fed calls “depository institutions”) held with it.  The interest payments for required reserves do not matter here, since banks had to keep that money with the Fed anyway.  But by also paying interest on excess reserves, the Fed put a floor under the rate of return that banks demanded from their regular investments (i.e. loans).

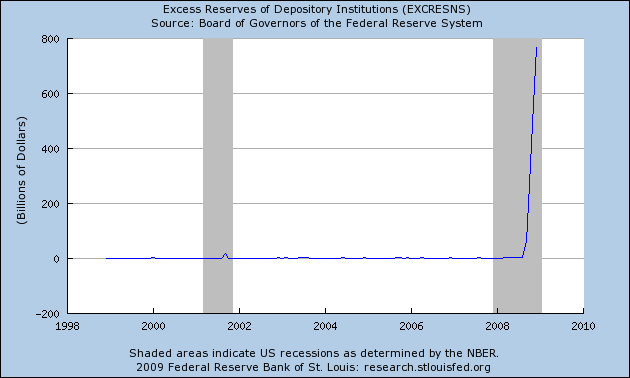
The interest rate paid on excess returns has been altered a number of times (see the press releases on 22 Oct, 5 Nov and 16 Dec), but the key point is this:  Suppose that the Fed will pay x% on excess reserves.  That is a risk-free x% available to banks if they want it, while normal investments all involve some degree of risk.  US depository institutions suddenly had a direct incentive to back out of any investment that had a risk-adjusted rate of return less than x% and to put the money into reserve instead, and boy did they jump at the chance.  Excess reserves have leapt tremendously:

Excess Reserves of Depository Institutions (USA, Accessed: 7 January 2009)
Excess Reserves of Depository Institutions (USA, Accessed: 7 Jan 2009)

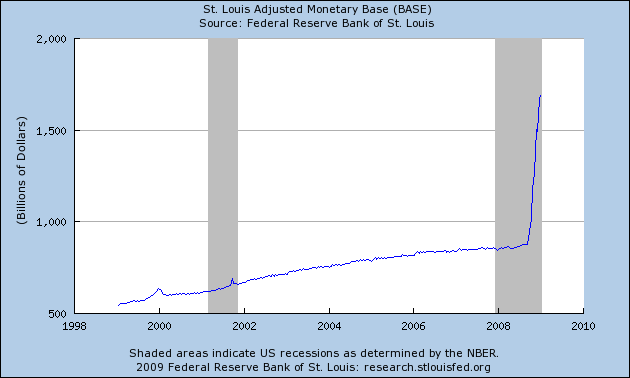
Corresponding, the monetary base (M0) has soared:

Adjusted Monetary Base (USA, Accessed: 7 Jan 2009)

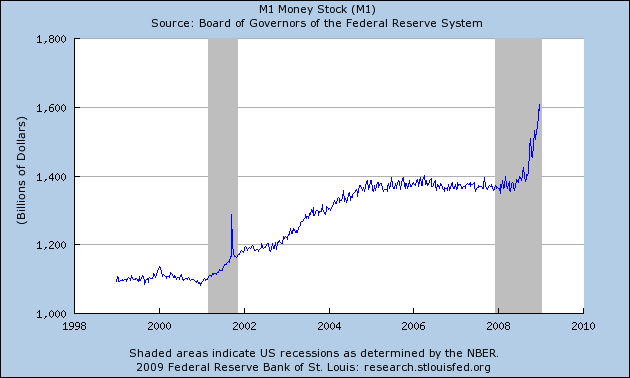
If we think of M1 as being M1 = M0 + non-reserve deposits, then we would have expected M1 to increase by similar amounts (a little under US$800 billion).  In reality, it’s only risen by US$200 billion or so:

M1 Money Supply (USA, Accessed: 7 Jan 2009)
M1 Money Stock (USA, Accessed: 7 Jan 2009)

So where have the other US$600 billion come from?  Other countries.

Remember that the real definition of M1 is M1 = Physical currency in circulation + deposit accounts.  The Federal Reserve, when calculating M1, only looks at deposits in America.

By contrast, the definition of the monetary base is M0 = Physical currency in circulation + reserves held at Federal Reserve.  The Fed knows that those reserves came from American depository institutions, but it has no idea where they got it from.

Consider Citibank.  It collects deposits from all over the world, but for simplicity, imagine that it only collects them in America and Britain.  Citibank-UK will naturally keep a fraction of British deposits in reserve with the Bank of England (the British central bank), but it is free to invest the remainder wherever it likes, including overseas.  Since it also has an arm in America that is registered as a depository institution, putting that money in reserve at the Federal Reserve is an option.

That means that, once again, if Citibank-UK can’t get a risk-adjusted rate of return in Britain that is greater than the interest rate the Fed is paying on excess reserves, it will exchange the British pounds for US dollars and put the money in reserve at the Fed.  The only difference is that the risk will now involve the possibility of exchange-rate fluctuations.

It’s not just US-based banks with a presence in other countries, though.  Any non-American bank that has a branch registered as a depository institution in America (e.g. the British banking giant, HSBC) has the option of changing their money into US dollars and putting them in reserve at the Fed.

So what does all of that mean?  I see two implications:

  1. Large non-American banks that have American subsidiaries are enjoying the free money that the Federal Reserve is handing out.  By contrast, smaller non-American banks that do not have American subsidiaries are not able to access the Federal Reserve system and so are forced to find other investments.
  2. The US$600+ billion of foreign money currently parked in reserve at the Fed had to come out of the countries of origin, meaning that it is no longer there to stimulate their economies.  By starting to pay interest on excess reserves, the US Federal Reserve effectively imposed an interest rate increase on other countries.

Glorious, uber-Nerd data

In the USA, the CBO has just released a microscopically-detailed breakdown on how federal taxes are paid for by household for the years 1979 through to 2005 inclusive.  Everything is provided by quintile, with the top 20% being broken down into percentiles 81-90, 91-95, 95-99, 99.0-99.5, 99.5-99.9, 99.9-99.99 and the top 0.01%.

It includes, for each of those groups:

  • Effective Federal Tax Rates (Total Tax, Individual Income Tax, Social Insurance Tax, Corporate Income Tax and Excise Tax);
  • The share of federal government revenue for each of those;
  • Average pre-tax income;
  • Average post-tax income;
  • Minimum post-tax income;
  • Share of national pre-tax income;
  • Share of national post-tax income; and
  • (Wonder of wonders!) Sources of income.