Afghan opium production (Updated)

The UN Office on Drugs and Crime has just released their latest report, including details on opium production in Afghanistan. Here are a few of the statistics:

2006 Year-on-year difference 2007
Net opium poppy cultivation 165,000 ha +17% 193,000 ha
In per cent of agricultural land 3.65% 4.27%
Eradication 15,300 ha +24% 19,047 ha
Weighted average opium yield 37.0 kg/ha +15% 42.5 kg/ha
Potential production of opium 6,100 mt +34% 8,200 mt
In percent of global production 92% 93%
Number of households involved in opium cultivation 448,000 +14% 509,000
Afghanistan GDP US$ 6.7 billion +12% US$ 7.5 billion
Afghanistan GDP per capita US$ 290 +7% US$ 310
Total farm-gate value of opium in per cent of GDP 11% 13%
Indicative gross income from opium per ha US$ 4,600 +13% US$ 5,200
Indicative gross income from wheat per ha US$ 530 +3% US$ 546

Make sure you read that correctly: Area under cultivation is up 17% and area eradicated is up 24%. That might make you think (as it did me originally) that the total area producing is down, but you’d be wrong … the 17% was on a huge area and the 24% was on a tiny area. Net productive area went from 149,700 ha to 173,953 ha — an increase of 16%. On top of that, yield per hectare is up 15%, so overall output is up 34%.

GDP/capita is US$310 and — assuming that your crop isn’t eradicated by the US — income from growing opium poppy is US$5,200 per hectare (or $US2,100 per acre). That’s an awfully big incentive. On top of all that, I understand that one of the big appeals of growing poppy is that opium has an extremely high value per unit volume and per unit weight, which are important considerations for a farmer living in a country with very low-quality and high-cost transportation infrastructure.

I wonder how they got the yield up so quickly? Was it improved infrastructure (watering systems), the dedication of better quality land to poppy cultivation, better inputs (fertilizer) or something else? Whatever the answer, that looks to me to be fairly serious evidence of planned investment. These farmers are not just doing this on the side.

This would be a good time to point readers to this opinion piece by Willem Buiter (blog, NBER, LSE) . The discussion by other FT contributors is also well worth reading. Here’s a taster from the first paragraph so you know what he’s saying:

As an economist with a strong commitment to personal liberty and responsibility, my preference would be to see all illegal drugs legalised. The only exception would be substances whose consumption leads to behaviour likely to cause material harm to others.

Further update (30 Aug):

The Economist has produced this graph to illustrate world opium production since 1990:

[ Image removed because it was messing with my site. Click on the Economist link to see it ]
Two questions for the punters

1) Does the large gap in the implied probabilities of a Labor win in the upcoming Australian Federal Election between overall-result betting (62% at the latest update) versus seat-by-seat betting (23% at the latest update) imply some sort of arbitrage opportunity? Is the overround really that large?

2) Why the gap in the first place? I assume it’s got something to do with the particulars of just how marginal each seat is (see below), but why do the two markets disagree so much? Is one of them massively incorrect?

For those that don’t know, I’d recommend looking at the tabular and graphical representations of the marginal seats here. Here are the guts of it (there are 150 seats in the House of Representatives):

Uniform swing Labor gains Labor total Coalition total Result
2.92% (+13) 73 75 Clear Coalition win
3.27% (+14) 74 74 Sort-of-hung parliment (depending on the two independents)
3.27% (+15) 75 73 Sort-of-hung parliment (depending on the two independents)
4.85% (+16) 76 72 Clear Labor win

The first 13 seats for Labor only need a 2.92% swing, or 0.22% per seat. The 14th seat will take an extra 0.35%, the 15th a further 0.90% again and the 16th another 0.71% on top. Remember that each extra percent of swing to Labor takes an increasing amount of goodwill from the electorate (i.e. increasing your swing from 1% to 2% is doable, but increasing it from 25% to 26% is effectively impossible).

Moving the mainstream (some notes)

I’ve been wanting to write an essay on this for ages, but every time I think or talk to someone about it, I get hit with more ideas and different approaches. In the interests of not forgetting them, I thought it might be worthwhile formalising, if not my opinions, then at least the topics that I want to write on. I’m very interested in people’s opinions on these, so if you have a particular view, please leave some comments.

  1. Economics as an expression of ideology
  2. Language choice as:
    1. (+ve) a means of aiding communication in a specialised field
    2. (+ve) a means of enforcing definitional and therefore intellectual rigour [e.g. arguments over the meaning of “market failure”]
    3. (~) a shaper of methodology
    4. (~) a signal of author competence or paper quality [e.g. “the market for lemmas” or the comment made by a French philosopher, mentioned by Daniel Dennett in a footnote of his book “Breaking the spell”]
    5. (-ve) an embodiment of ideology or bias [e.g. 95% of the work in feminism interpretting literature seems to be in highlighting this sort of stuff]
    6. (-ve) a barrier to outside comment or involvement
  3. The fact that mathematics in general and modelling in particular are each a choice of language
  4. “All models are wrong; some are useful” — George Box
  5. The different purposes of models:
    1. to explore the implications of particular assumptions [moving forwards]
    2. to illustrate the possibility (or plausibility) of a particular outcome [moving backwards]
    3. to explain an observed outcome, or a collection of observed outcomes [moving backwards]
  6. Closed-form (i.e. analytically solvable) modelling versus simulation modelling
  7. Empirical work: justifying assumptions versus confirming outcomes (or challenging either)
  8. Simplifying assumptions versus substantive assumptions
  9. The reasonableness of assumptions:
    1. Representative assumptions [e.g. Friedman’s billiards player]
    2. Direct behaviour versus emergent behaviour
    3. The importance of context [e.g. what is valid at the individual level may not be at the aggregate level]
  10. Fashions and fads in academia. The conflict between:
    1. The need to tackle “the big issues”
    2. The desire to stand out (do something different)
    3. The impulse to follow-the-leader/jump-on-the-bandwagon
    4. The (incentive driven ?) need to publish rapidly, frequently and consistently [i.e. the mantra of “publish or perish“]
    5. The desire to influence real-world policy or public opinion
  11. Heuristics in academia. Rules-of-thumb or a preference for particular techniques. Is it “better” to learn a few types of model extremely well than several models reasonably well? It does allow researchers to jump onto a new topic and produce a few papers very quickly … [e.g. this]
  12. Mainstream conclusions (or opinions) versus mainstream methodology
  13. How to move the mainstream:
    1. Stay in and push or jump out and call to those still in? [e.g. See, in particular, all the discussion on the topic of heterodoxy vs. orthodoxy and Keynesianism vs. Neoclassicalism around the blogosphere before, during and after this comment by Brad DeLong]
    2. The importance of data
    3. The importance of tone and language
    4. The importance of location (both institution and country) [e.g. Justin Wolfers: “I could do the same work I’m doing now for an Australian institution, and the truth is, no one would listen“]
    5. The importance of academic standing
    6. The risk versus the reward

Managing the news cycle

Peter Martin draws attention to the Australian Treasury press release listing the adjusted figures for the government surplus in 2006-07:

Preliminary estimates indicate that the Australian Government general government sector recorded an underlying cash surplus of $17.3 billion for 2006-07, which is $3.7 billion higher than expected at the time of the 2007-08 Budget.

A commenter on Peter’s site asks the obvious question:

Is it a good thing that treasury gets it’s numbers so consistently wrong? Who is responsible for the mistake – in this case an error of 27%. If it had gone 27% the other way who would have copped it?

27% is indeed a very large adjustment, and it’s rather difficult to imagine this sort of revision being made in the other direction. It is possible that the adjustment is just as much a surprise to Mr Costello as it (nominally) is to the media, but I suspect that it was always known – or at least believed – in the Treasury that the figures included in the 2007-08 Budget were too low. They will have, at best, decided to err on the side of caution (in case their internal numbers were wrong or there was a sudden crisis that worked against it) and, at worst, knowingly understated the true figures in order to guarantee the political capital boost they’d get later in the election cycle (i.e. now) when the upwardly revised figures were released.

I’ll leave it up to the audience to come to their own conclusions on which is the more likely explanation.

Upgrading wordpress + theme

Apologies for the mess … I’ve upgraded to v2.2.2 of WordPress and moved over to K2 for my theme. If anyone has a recommendation for a K2 style I might use, let me know.

You should notice a few largely-pointless-but-still-pretty-cool AJAX features appearing over the next few days and weeks.

A course in Political Economy

Brad DeLong has mused on the purpose of a course in political economy:

This is where we cash in our winning intellectual bets, tie all the threads together, and come up with running code for a rough-and-ready framework for thinking about everything that happens at the crossroads where history and politics meet economies and sociologies in a world where village elders along the Zambezi lecture the principal deputy managing director of the International Monetary Fund on the implications of the Republican convention.

I sat in on a few lectures for LSE’s graduate-level course in this stuff over the last year (I may yet take it formally as my second optional) and I have to say that I find Brad’s vision a lot more interesting. Perhaps I should be doing my PhD at Berkeley?

Volatility and the value of historical context

Greg Mankiw has a brief note (I’ll include it verbatim):

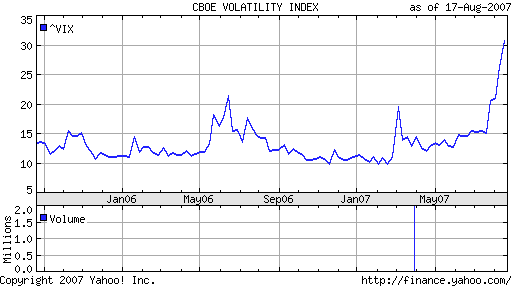
This is the VIX index, which uses options prices to measure expected stock market volatility over the next 30 days. The latest run-up is striking. It suggests that the recent bumpy ride in financial markets is likely to continue for a while.

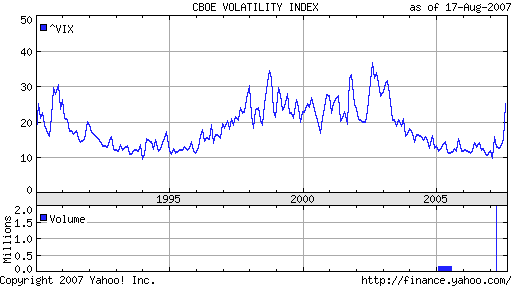
I had never heard of the VIX Index before (yet another thing to add to the shamefully-ignorant-about pile), but I do notice that while the 2-year graph Prof. Mankiw includes makes the current turmoil look unprecedented, it’s actually nothing of the sort. Here’s the same graph over the maximum possible period:

Looking at this, the recent brouhaha is certainly serious, but is also certainly no worse (yet) than we’ve had before. The LTCM (1998) and 9/11 (2001) events are clearly discernible. Other than those two, I have no idea why volatility was so high between 1997 and 2003, or why it spiked in 1990 (something to do with the then-upcoming recession?).

Conspiracy theories and the current market turmoil

A friend pointed me to this conspiracy theory video. I’ve not watched more than 30 seconds of this particular video, but according to discussion on the RANDI forums, I understand that it splices footage directly from a number of other conspiracy theory films into one, with all the greatest hits of the anti-establishment anarchist left being given a run (christians and/or jews are evil and secretly rule the world, 9/11 was a government inside job, the entire global banking system is a sham and run by bad people, etc).

Of more interest to me is this question, put to me by my friend:

Why are more and more of these conspiracy theories coming out in video format only, with no transcriptions?

Perhaps it’s to appeal to a wider audience (i.e. more people are willing to watch a movie than read the equivalent text). Perhaps it’s because a movie can more readily achieve an intense, even emotional, impact than abstract text. Perhaps it’s just another example of market demand and supply …

The real (as in true) explanations for what goes on tend to be considerably more complex and almost infinitely more tedious than those offered by conspiracy theorists. People seem to want answers, but aren’t willing to accept that they might be anything other than simple and exciting. Maybe that’s a result of today’s media culture of soundbite-driven news and action movies, but maybe it’s just an unfortunate consequence of otherwise rational ignorance. You can’t be an expert in everything (strictly speaking, it’s too costly), so you don’t waste your time trying and instead trust the summaries given by people you take to be experts.

As an example of the demand for simplified summaries, consider the recent turmoil on the world’s credit- and stock-markets. I have spoken to several people about the happenings and most of them aren’t the least bit interested in understanding the details of what’s going on. Instead, they only want to know if (a) the world is going to end (i.e. they’re going to lose their job or their pension savings are going to collapse) or (b) if it’s all been caused by evil, money-grubbing people deliberately destabilising the world for their private profit.

By my thinking, to really understand the current turmoil (I still refuse to call it a crisis), you need to understand the basics of:

  • How bonds work
  • The difference between long-term and short-term bonds
  • The difference between government and commercial securities
  • The fact that central banks announce a target interest rate rather than fixing it by fiat
  • Reserve requirements
  • Overnight inter-bank lending
  • How banks view loans to consumers (i.e. as assets)
  • Structured finance in general
  • CDOs in particular
  • Derivatives
  • Hedging and hedge funds
  • The difference between credit markets, stock markets and foreign exchange markets and how movements in each might affect the others
  • The carry trade

And that’s before you start considering the psychology of the people involved and all the resulting work in behavioural finance. Unless you’re seriously (and usually, professionally) interested in investment, finance or economics, why would you care about all of those details? You wouldn’t … you just want to know if the world is going to end and if there’s somebody to blame.

On the supply side of these nuggets of information, you have … well, you’re looking at one. Commentators, both professional (in the mainstream media) and self-appointed (in your local pub and all over the internet) are competing to convince you that they are experts in the topic at hand and having managed that, to provide you with their summarised opinions.

Suppose, however, that for some reason you can’t properly identify who is a real expert or you have some reason to distrust the experts you can identify. In that case, you’re left taking in the simplified views of non-expert subject-matter aficionados, of which a small but statistically-significant fraction are going to be conspiracy theorists. Insofar as they want to expand their customer base, conspiracy theorists (who, to be frank, are often less troubled by the truth than they are with attracting an audience) will experiment with their provision of service to best meet the demand for simple and exciting explanations. Thus, we have movies with no (tedious) transcripts.

The exponential rise of bureaucracy

Bureaucracy has been getting worse for years. Bigger, more complex, more self-referential, self-justifying, self-absorbed. More impenetrable. The language of bureaucracy has been changing as some sort of linguistic mirror of the organisation itself. It has happened in the public service at all three levels and in the private sector. It has happened in every industry. Why? My current thoughts, in three slightly overlapping points:

Point 1) The distribution of demand across skills and abilities has been changing. As we’ve moved away from agriculture, through manufacturing and towards services and office work, the need for administrative, bureaucratic tasks has increased.

Point 2) The distribution of task-related ability across the population has not changed, or at least has not changed much. There might be more people going to university, but there are limits to how much education can enhance a person’s innate ability.

Point 3) (a) A high-ability person will get more done than a low-ability person, irrespective of their coworkers.

Point 3) (b) The productivity of a person is influenced by the ability of their co-workers, so that high-ability coworkers will raise your productivity and low-ability coworkers will lower your productivity.

Point 3) (c) There is an optimal size to a team. Even if everyone is of equal ability, per-person productivity will (initially) rise with the size of the team, peak, and then start to fall.

Points 1 and 2 mean that the need for bureaucratic work is increasing, but the number of people needed to do that work is increasing faster because the ability of the marginal (new) bureaucrat is less than the average ability of the existing bureaucratic workforce. Point 3 means that the gap between these two growth rates increases as the demand for bureaucratic work increases. As an illustration, I imagine the demand for bureaucratic tasks increasing linearly, but the size of the bureaucracy (and the inner complexity of it) needed to provide this service increasing exponentially.

How do we fight this? I see three ways:

a) Try harder to shift the distribution of ability over the population. The Aust/UK governments are aware of this, but have unfortunately settled for simply lowering the bar for getting into university. A generous commentator might acknowledge that they had the best intentions at heart, but the end result is one set of numbers going up, the value of those numbers going down and the problem remaining the same. Seriously working to address the problem via this tack — if it can be done from this angle at all — could only be done over a timeframe of 20+ years.

b) Work to slow (or, ideally, reverse) the increasing demand for bureaucratic work in the first place. Cut red tape. Stop trying to watch, record, register and regulate everything. Remove overlap.

c) Decrease bureaucratic team sizes. Make them specialise. Specifically link bureaucratic teams to the end-consumers that they are nominally serving.