This is quite a long post. I hope you’ll be patient and read it all – there are plenty of pretty graphs!
I have previously spoken about the need for some perspective when looking at the current recession. At the time (early Dec 2008), I was upset that every regular media outlet was describing the US net job losses of 533k in November as being unprecedentedly bad when it clearly wasn’t.
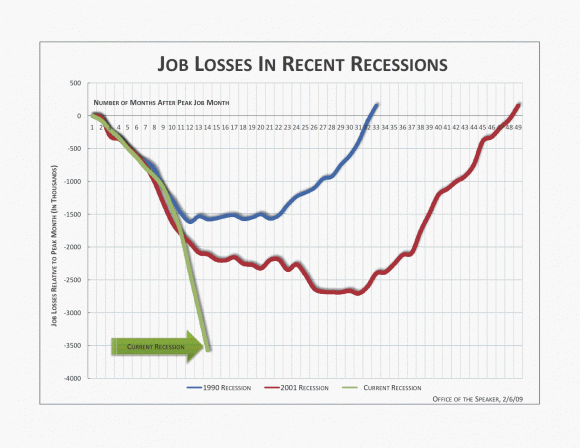
About a week ago, the office of Nancy Pelosi (the Speaker of the House of Representatives in the US) released this graph, which makes the current recession look really bad:
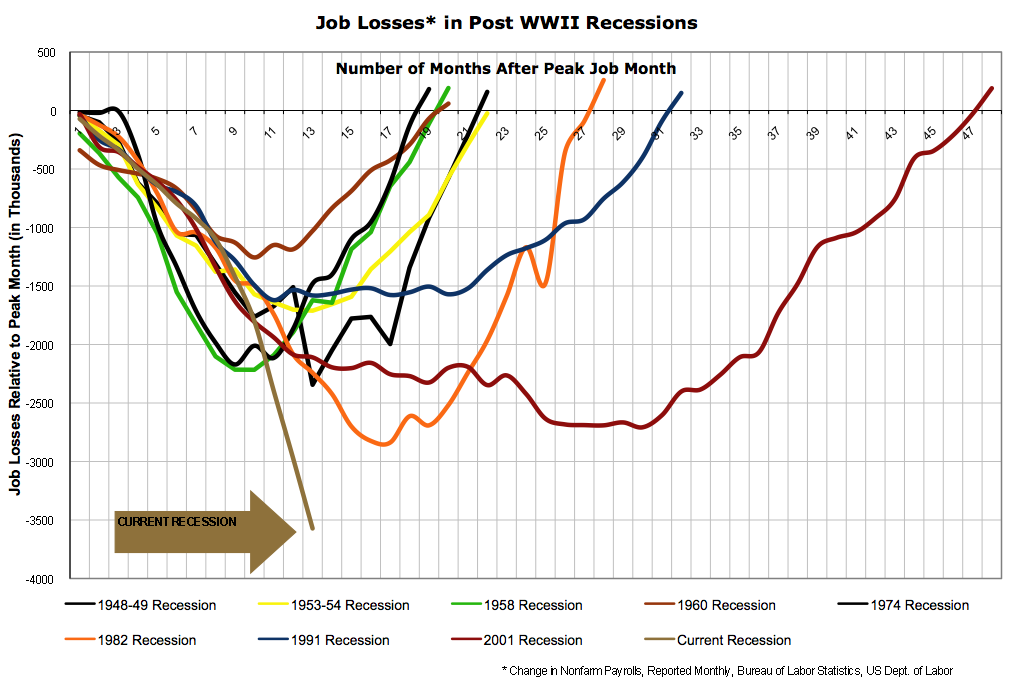
Notice that a) the vertical axis lists the number of jobs lost and b) it only includes the last three recessions. Shortly afterward, Barry Ritholtz posted a graph that still had the total number of jobs lost on the vertical axis, but now included all post-World War Two recessions:
Including all the recessions is an improvement if only for the sake of context, but displaying total job losses paints a false picture for several reasons:
- Most importantly, it doesn’t allow for increases in the population. The US residential population in 1974 was 213 million, while today it is around 306 million. A loss of 500 thousand jobs in 1974 was therefore a much worse event than it is today.
- Until the 1980s, most households only had one source of labour income. Although the process started slowly much earlier, in the 1980s very large numbers of women began to enter the workforce, meaning that households became more likely to have two sources of labour income. As a result, one person in a household losing their job is not as catastrophic today as it used to be.
- There has also been a general shift away from full-time work and towards part-time work. Only looking at the number of people employed (or, in this case, fired) means that we miss altogether the impact of people having their hours reduced.
- We should also attempt to take into account discouraged workers; i.e. those who were unemployed and give up even looking for a job.
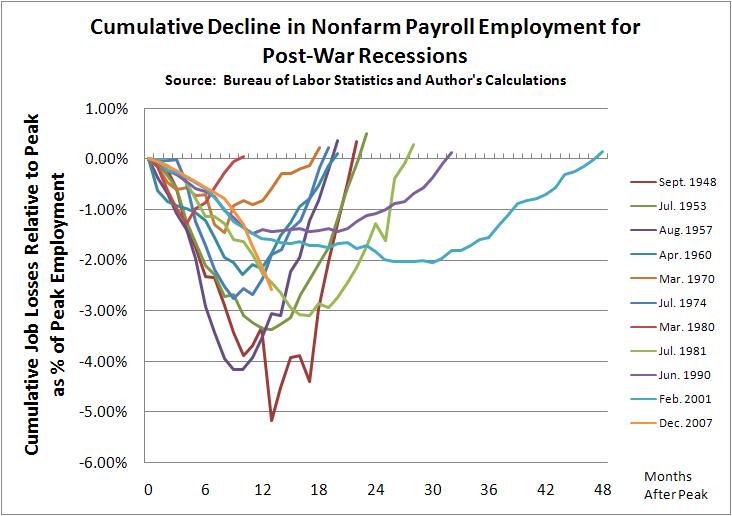
Several people then allowed for the first of those problems by giving graphs of job loses as percentages of the employment level at the peak of economic activity before the recession. Graphs were produced, at the least, by Justin Fox, William Polley and Calculated Risk. All of those look quite similar. Here is Polley’s:
The current recession is shown in orange. Notice the dramatic difference to the previous two graphs? The current recession is now shown as being quite typical; painful and worse than the last two recessions, but entirely normal. However, this graph is still not quite right because it still fails to take into account the other three problems I listed above.
(This is where my own efforts come in)
The obvious way to deal with the rise of part-time work is to graph (changes in) hours worked rather than employment.
The best way to also deal with the entry of women into the workforce is to graph hours worked per member of the workforce or per capita.
The only real way to also (if imperfectly) account for discouraged workers is to just graph hours worked per capita (i.e. to compare it to the population as a whole).
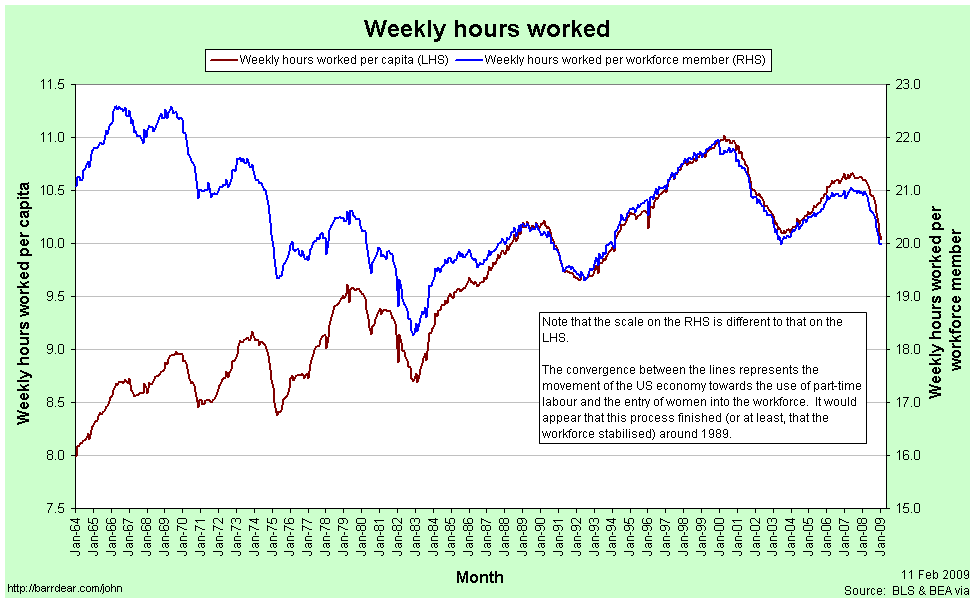
This first graph shows Weekly Hours Worked per capita and per workforce member since January 1964:
In January 1964, the average member of the workforce worked just over 21 hours per week. In January 2009 they worked just under 20 hours per week.
The convergence between the two lines represents the entry of women into the workforce (the red line is increasing) and the increasing prevalence of part-time work (the blue line is decreasing). Each of these represented a structural change in the composition of the labour force. The two processes appear to have petered out by 1989. Since 1989 the two graphs have moved in tandem.
[As a side note: In econometrics it is quite common to look for a structural break in some timeseries data. I’m sure it exists, but I am yet to come across a way to rigorously handle the situation when the “break” takes decades occur.]
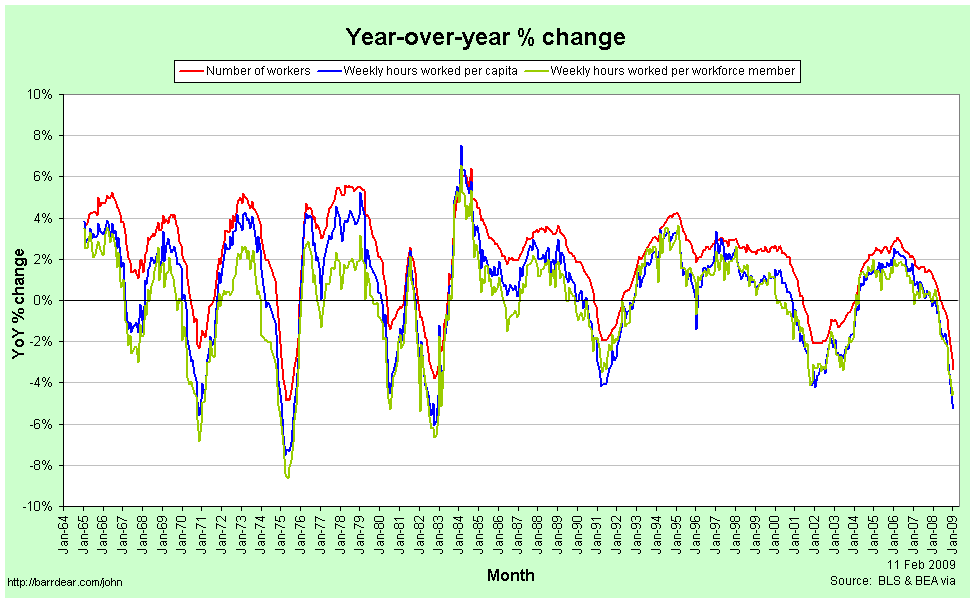
The next graph shows Year-over-Year percentage changes in the number of employed workers, the weekly hours per capita and the weekly hours per workforce member:
Note that changes in the number of workers are consistently higher than the number of hours per workforce member or per capita. In a recession, people are not just laid off, but the hours that the remaining employees are given also falls, so the average number of hours worked falls much faster. In a boom, total employment rises faster than the average number of hours, meaning that the new workers are working few hours than the existing employees.
This implies that the employment situation faced by the average individual is consistently worse than we might think if we restrict our attention to just the number of people in any kind of employment. In particular, it means that from the point of view of the average worker, recessions start earlier, are deeper and last longer than they do for the economy as a whole.
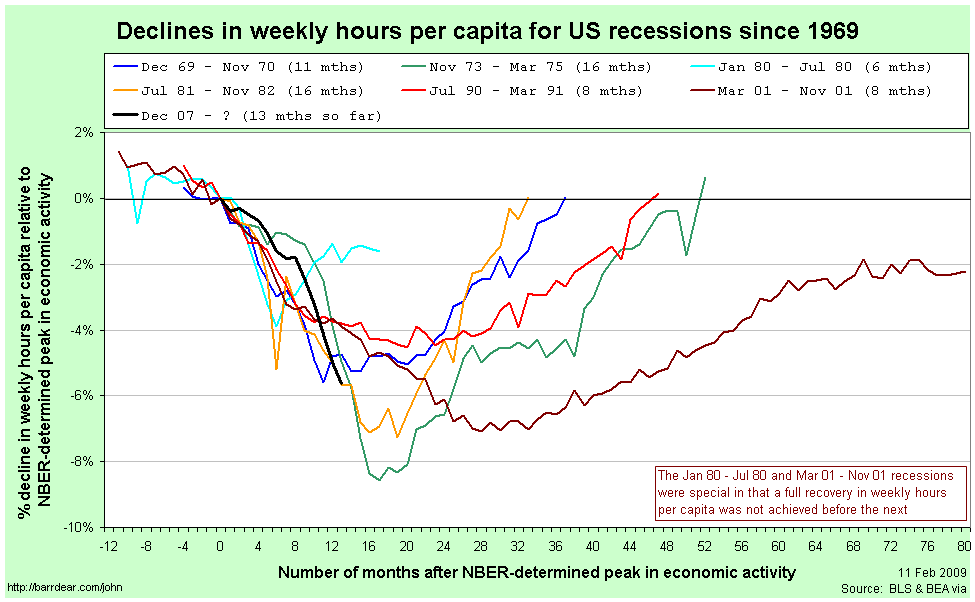
Here is the comparison of recessions since 1964 from the point of view of Weekly Hours Worked per capita, with figures relative to those in the month the NBER determines to be the peak of economic activity:
The labels for each line are the official (NBER-determined) start and end dates for the recession. There are several points to note in comparing this graph to those above:
- The magnitudes of the declines are considerably worse than when simply looking at aggregate employment.
- Declines in weekly hours worked per capita frequently start well before the NBER-determined peak in economic activity. For the 2001 recession, the decline started 11 months before the official peak.
- For two recessions out of the last seven – those in 1980 and 2001 – the recovery never fully happened; another recession was deemed to have started before the weekly hours worked climbed back to its previous peak.
- The 2001 recession was really awful.
- The current recession would appear to still be typical.
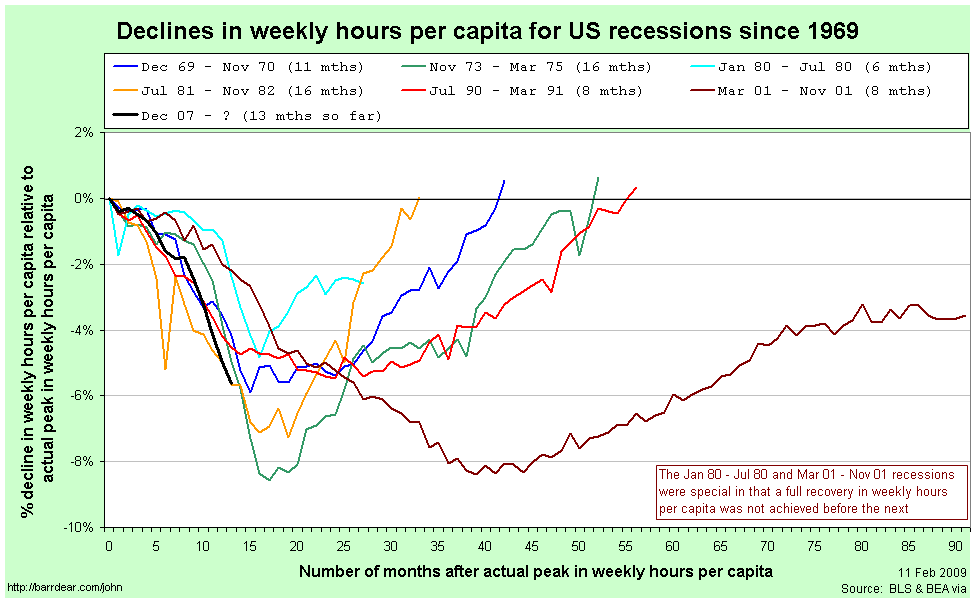
Since so many of the recessions started – from the point of view of the average worker – before the NBER-determined date, it is helpful to rebase that graph against the actual peak in weekly hours per capita:
Now, finally, we have what I believe is an accurate comparison of the employment situation in previous recessions.
Once again, the labels for each line are the official (NBER-determined) start and end dates for the recession. By this graph, the 2001 recession is a clear stand-out. It fell the second furthest (and almost the furthest), lasted by far the longest and the recovery never fully happened.
The current recession also stands out as being toward the bad end of the spectrum. It is the equally worst recession by this point since the peak. It will need to continue getting a lot worse quite quickly in order to maintain that record, however.
After seeing Calculated Risk’s graph, Barry Ritholtz asked whether it is taking longer over time to recover from a recession recoveries (at least in employment). This graph quite clearly suggests that the answer is “no.” While the 2001 and 1990/91 recessions do have the slowest recoveries, the next two longest are the earliest.
Perhaps a better way to characterise it is to compare the slope coming down against the slope coming back up again. It seems as a rough guess that rapid contractions are followed by just-as-rapid rises. On that basis, at least, we have some slight cause for optimism.
If anybody is interested, I have also uploaded a copy of the spreadsheet with all the raw data for these graphs. You can access it here: US Employment (excel spreadsheet)
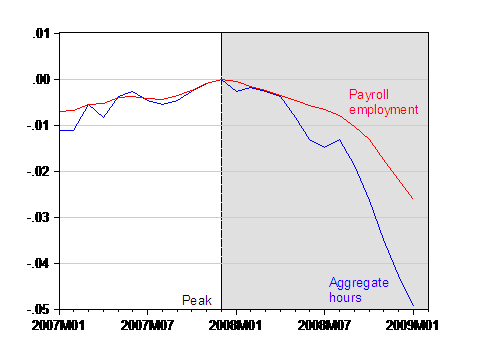
For reference, the closest other things that I have seen to this presentation in the blogosphere are this post by Spencer at Angry Bear and this entry by Menzie Chinn at EconBrowser. He provides this graph of employment versus aggregate hours for the current recession only:
