History of US Legislative and Executive power (again)

Ages ago, I wrote briefly about the history of US legislative and executive power.  I thought I’d update it now that the latest election has (pretty much) settled.  Between 1901 and 2010, the Democratic Party will have been in power in the House of Representatives 65.5% of the time, in the Senate 58.2% of the time and had the presidency 50% of the time.

Much more interestingly, Americans seem to prefer having the same party control all three branches of US government at the same time.  While pure chance would put such an occurrence at 25% (i.e. two out of eight possible configurations), it actually occurred over 61% of the time (33 congresses out of 54).  Of those 33, 21 were all-Democrat and 12 were all-Republican.

Click on the image below to go through to an excel spreadsheet with the details:
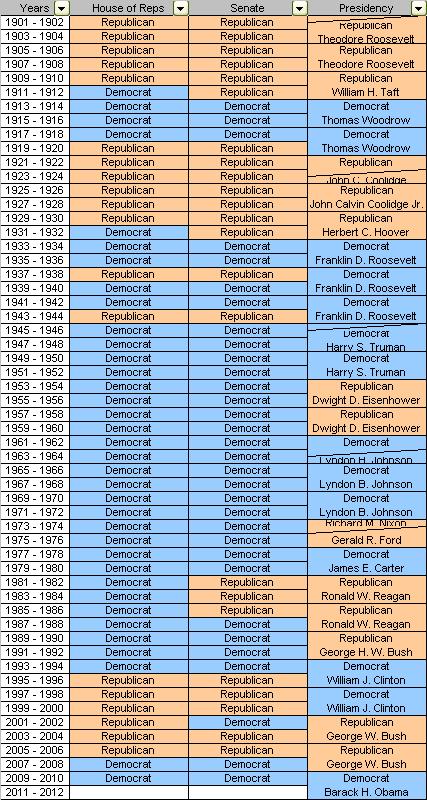
History of US legislative and executive power (1901-2010)

History of US Legislative and Executive power

Following the recent (midterm) US elections and looking at this article over at the Economist, I was fascinated by the graphic they provided at the bottom detailing periods of Democrat and Republican control over the House of Representatives and the Senate. The obvious missing information was on presidential control, so I did one up myself. You can grab it (as an Excel spreadsheet) here.

It’s interesting to note that since 1901, the Democrats have generally been dominant in the House of Representatives (64.8% of overall control) and the Senate (57.4%), but the Republicans have maintained a slight upper hand in the Presidency (48.1% Democrat).

Americans do seem to prefer having just one party in control at a time (59.3% of the time all three are under the control of the same party rather than the 25% that would have been expected by pure chance).

Update: I have redone this following the 2008 election here.