US treasury interest rates and (disin|de)flation

This Bloomberg piece from a few days ago caught my eye.  Let me quote a few hefty chunks from the article (highlighting is mine):

Bond investors seeking top-rated securities face fewer alternatives to Treasuries, allowing President Barack Obama to sell unprecedented sums of debt at ever lower rates to finance a $1.47 trillion deficit.

While net issuance of Treasuries will rise by $1.2 trillion this year, the net supply of corporate bonds, mortgage-backed securities and debt tied to consumer loans may recede by $1.3 trillion, according to Jeffrey Rosenberg, a fixed-income strategist at Bank of America Merrill Lynch in New York.

Shrinking credit markets help explain why some Treasury yields are at record lows even after the amount of marketable government debt outstanding increased by 21 percent from a year earlier to $8.18 trillion. Last week, the U.S. government auctioned $34 billion of three-year notes at a yield of 0.844 percent, the lowest ever for that maturity.
[…]
Global demand for long-term U.S. financial assets rose in June from a month earlier as investors abroad bought Treasuries and agency debt and sold stocks, the Treasury Department reported today in Washington. Net buying of long-term equities, notes and bonds totaled $44.4 billion for the month, compared with net purchases of $35.3 billion in May. Foreign holdings of Treasuries rose to $33.3 billion.
[…]
A decline in issuance is expected in other sectors of the fixed-income market. Net issuance of asset-backed securities, after taking into account reinvested coupons, will decline by $684 billion this year, according to Bank of America’s Rosenberg. The supply of residential mortgage-backed securities issued by government-sponsored companies such as Fannie Mae and Freddie Mac is projected to be negative $320 billion, while the debt they sell directly will shrink by $164 billion. Investment- grade corporate bonds will decrease $132 billion.

“The constriction in supply is all about deleveraging,” Rosenberg said.
[…]
“There’s been a collapse in both consumer and business credit demand,” said James Kochan, the chief fixed-income strategist at Menomonee Falls, Wisconsin-based Wells Fargo Fund Management, which oversees $179 billion. “To see both categories so weak for such an extended period of time, you’d probably have to go back to the Depression.”

Greg Mankiw is clearly right to say:

“I am neither a supply-side economist nor a demand-side economist. I am a supply-and-demand economist.”

(although I’m not entirely sure about the ideas of Casey Mulligan that he endorses in that post — I do think that there are supply-side issues at work in the economy at large, but that doesn’t necessarily imply that they are the greater fraction of America’s macroeconomic problems, or that demand-side stimulus wouldn’t help even if they were).

When it comes to US treasuries, it’s clear that shifts in both demand and supply are at play.  Treasuries are just one of the investment-grade securities on the market that are, as a first approximation, close substitutes for each other.  While the supply of treasuries is increasing, the supply of investment-grade securities as a whole is shrinking (a sure sign that demand is falling in the broader economy) and the demand curve for those same securities is shifting out (if the quantity is rising and the price is going up and supply is shifting back, then demand must also be shifting out).

Paul Krugman and Brad DeLong have been going on for a while about invisible bond market vigilantes, criticising the critics of US fiscal stimulus by pointing out that if there were genuine fears in the market over government debt, then interest rates on the same (which move inversely to bond prices) should be rising, not falling as they have been.  Why the increased demand for treasuries if everyone’s meant to be so afraid of them?

They’re right, of course (as they so often are), but that’s not the whole picture.  In the narrowly-defined treasuries market, the increasing demand for US treasuries is driven not only by the increasing demand in the broader market for investment-grade securities, but also by the contraction of supply in the broader market.

It’s all, in slow motion, the very thing many people were predicting a couple of years ago — the gradual nationalisation of hither-to private debt.  Disinflation (or even deflation) is essentially occurring because the government is not replacing all of the contraction in private credit.

More on the US bank tax

Further to my last post, Greg Mankiw — who is not a man to lightly advocate an increase in taxes on anything, but who understands very well the problems of negative externalities and implicit guarantees — has written a good post on the matter:

One thing we have learned over the past couple years is that Washington is not going to let large financial institutions fail. The bailouts of the past will surely lead people to expect bailouts in the future. Bailouts are a specific type of subsidy–a contingent subsidy, but a subsidy nonetheless.

In the presence of a government subsidy, firms tend to over-expand beyond the point of economic efficiency. In particular, the expectation of a bailout when things go wrong will lead large financial institutions to grow too much and take on too much risk.
[…]
What to do? We could promise never to bail out financial institutions again. Yet nobody would ever believe us. And when the next financial crisis hits, our past promises would not deter us from doing what seemed expedient at the time.

Alternatively, we can offset the effects of the subsidy with a tax. If well written, the new tax law would counteract the effects of the implicit subsidies from expected future bailouts.

My desire for a convex (i.e. increasing marginal rate of) tax derives from the fact that the larger financial institutions are on the receiving end of larger implicit guarantees, even after taking their size into account.

Update:  Megan McArdle writes, entirely sensibly (emphasis mine):

That implicit guarantee is very valuable, and the taxpayer should get something in return. But more important is making sure that the federal government is prepared for the possibility that we may have to make good on those guarantees. If we’re going to levy a special tax on TBTF banks, let it be a stiff one, and let it fund a really sizeable insurance pool that can be tapped in emergencies. Like the FDIC, the existance of such a pool would make runs less likely in the shadow banking system, but it would also protect taxpayers. Otherwise, with our mounting entitlement liabilities, we run the risk of offering guarantees we can’t really make good on.

I agree with the idea, but — unlike Megan — I would allow some of it to be collected directly as a tax now on the basis that the initial drawing-down of the pool came before any of the levies were collected (frustration at the political diversion of TARP funds to pay for the Detroit bailout aside).

Not raising the minimum wage with inflation will make your country fat

Via Greg Mankiw, here is a new working paper by David O. Meltzer and Zhuo Chen: “The Impact of Minimum Wage Rates on Body Weight in the United States“. The abstract:

Growing consumption of increasingly less expensive food, and especially “fast food”, has been cited as a potential cause of increasing rate of obesity in the United States over the past several decades. Because the real minimum wage in the United States has declined by as much as half over 1968-2007 and because minimum wage labor is a major contributor to the cost of food away from home we hypothesized that changes in the minimum wage would be associated with changes in bodyweight over this period. To examine this, we use data from the Behavioral Risk Factor Surveillance System from 1984-2006 to test whether variation in the real minimum wage was associated with changes in body mass index (BMI). We also examine whether this association varied by gender, education and income, and used quantile regression to test whether the association varied over the BMI distribution. We also estimate the fraction of the increase in BMI since 1970 attributable to minimum wage declines. We find that a $1 decrease in the real minimum wage was associated with a 0.06 increase in BMI. This relationship was significant across gender and income groups and largest among the highest percentiles of the BMI distribution. Real minimum wage decreases can explain 10% of the change in BMI since 1970. We conclude that the declining real minimum wage rates has contributed to the increasing rate of overweight and obesity in the United States. Studies to clarify the mechanism by which minimum wages may affect obesity might help determine appropriate policy responses.

Emphasis is mine.  There is an obvious candidate for the mechanism:

  1. Minimum wages, in real terms, have been falling in the USA over the last 40 years.
  2. Minimum-wage labour is a significant proportion of the cost of “food away from home” (often, but not just including, fast-food).
  3. Therefore the real cost of producing “food away from home” has fallen.
  4. Therefore the relative price of “food away from home” has fallen.
  5. Therefore people eat “food away from home” more frequently and “food at home” less frequently.
  6. Typical “food away from home” has, at the least, more calories than “food at home”.
  7. Therefore, holding the amount of exercise constant,  obesity rates increased.

Update: The magnitude of the effect for items 2) – 7) will probably be greater for fast-food versus regular restaurant food, because minimum-wage labour will almost certainly comprise a larger fraction of costs for a fast-food outlet than it will for a fancy restaurant.

US government debt

Greg Mankiw [Harvard] recently quoted a snippet without comment from this opinion piece by Kenneth Rogoff [Harvard]:

Within a few years, western governments will have to sharply raise taxes, inflate, partially default, or some combination of all three.

Reading this sentence frustrated me, because the “will have to” implies that these are the only choices when they are not.  Cutting government spending is the obvious option that Professor Rogoff left off the list, but perhaps the best option, implicitly rejected by the use of the word “sharply“, is that governments stabilise their annual deficits in nominal terms and then let the real growth of the economy reduce the relative size of the total debt over time.  Finally, there is an implied opposition to any inflation, when a small and stable rate of price inflation is entirely desirable even when a country has no debt at all.

Heck, we can even have annual deficits increase every year, so long as the nominal rate of growth plus the accrual of interest due is less than the nominal growth rate (real + inflation) of the economy as a whole and you’ll still see the debt-to-GDP ratio falling over time.

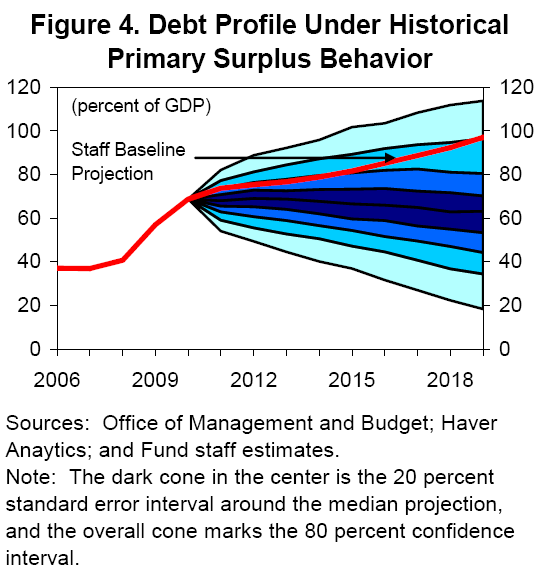
Via Minzie Chinn [U. of Wisconsin], I see that the IMF has a new paper looking at the growth rates of potential output, and the likely path of government debt in the aftermath of the credit crisis.  Using the the historical correlation between the primary surplus, debt, and output gap, they ran some stochastic simulations of how the debt-to-GDP ratio for America is likely to develop over the next 10 years.  Here’s the upshot (from page 37 of the paper):

IMF_US_debt_profile

Here is their text:

Combining the estimated historical primary surplus reaction function with stochastic forecasts of real GDP growth and real interest rates—and allowing for empirically realistic shocks to the primary surplus—imply a much more favorable median projection but slightly larger risks around the baseline. If the federal government on average adjusts the primary surplus as it has done in the past—implying a stronger improvement in the primary balance than under the baseline projections—the probability that debt would exceed 67 percent of GDP by year 2019 would be around 40 percent (Figure 4). Notably, with 80 percent probability, debt would be lower than the level it would reach under staff’s baseline by 2019. [Emphasis added]

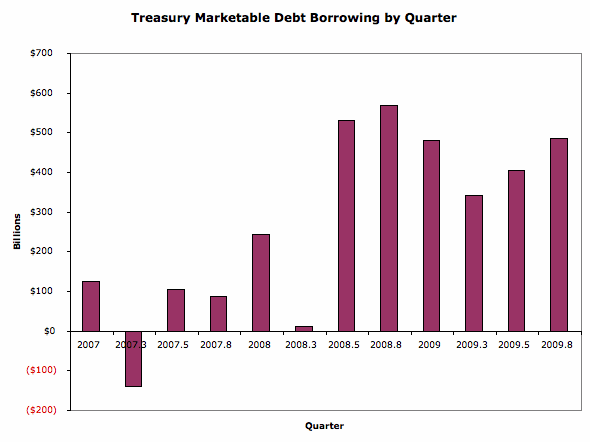
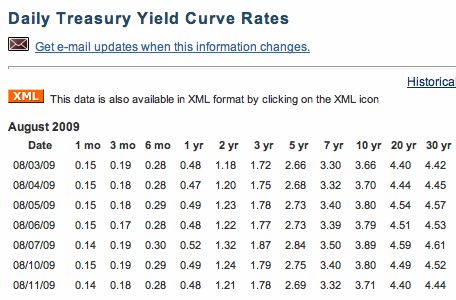
So I am not really worried about debt levels for America.  To be frank, neither is the the market, either, despite what you might have heard.  How do I know this?  Because the market, while clearly not perfectly rational, is rational enough to be forward-looking and if they thought that US government debt was a serious problem, they wouldn’t really want to buy any more of that debt today.  But the US has been selling a lot of new bonds (i.e. borrowing a lot of money) lately and the prices of government bonds haven’t really fallen, so the interest rates on them haven’t really gone up.  Here is Brad DeLong [Berkeley]:

[A] sharp increase in Treasury borrowings is supposed to carry a sharp increase in interest rates along with it to crowd out other forms of interest sensitive spending, [but it] hasn’t happened. Hasn’t happened at all:

Treasury marketable debt borrowing by quarterTreasury yield curve

It is astonishing. Between last summer and the end of this year the U.S. Treasury will expand its marketable debt liabilities by $2.5 trillion–an amount equal to more than 20% of all equities in America, an amount equal to 8% of all traded dollar-denominated securities. And yet the market has swallowed it all without a burp…

I don’t want to bag on Professor Rogoff. The majority of his piece is great: it’s a discussion of fundamental imbalances that need to be dealt with. You should read it. It’s just that I’m a bit more sanguine about US government debt than he appears to be.

The Chrysler bankruptcy

This is not a post about how Chrysler might work going forward, nor a post about how dastardly the hold-outs are.  This is a post about the distribution of haircuts and the move from White House-led negotiation to bankruptcy court.

There are broadly four groups of creditors:  The (sole remaining) shareholder, the union/pension-fund, the bond holders and the US government.

Clearly the shareholder should be wiped out.  The question is how much of a haircut everybody else should take.

I believe that by law, the US government would take the smallest haircut (get the largest fraction of their money back) as they’re super-senior, then the bond holders in decreasing order of seniority and the union/pension fund should get the biggest kick in the teeth.  The hold-outs were secured creditors, which means that if the company is liquidated they get a pretty senior claim on the proceeds.

[Update: Duh.  The government isn’t a super-senior bond holder, it’s a preferred share holder, which means that it’s claims, in principle, ought to be subordinate to the bond holders]

As I understand it, the deal on the table had the order differently.  The unions were getting back something like 60c on the dollar, the government 45c on the dollar and the bondholders 25c on the dollar (those numbers are made-up, but indicative).

That conflict between what would normally happen and the deal on offer was what gave rise to this sort of comment from Greg Mankiw:

The Rule of Law — Not!

Via the WSJ, here is the view from a “secured (sic) creditor” of Chrysler:

“Like many others I made the mistake of buying what I believed was ‘value,'” Mr. Gwin says, adding that investors who bought at the time believed the loans were worth more than their market price. “We did not contemplate having our first liens invalidated by a sitting president,” he adds.

As the President intervenes in more and more industries, a key question is how he does it and what he is trying to achieve. Is he trying to reorganize insolvent firms while, as much as possible, preserving the rights of stakeholders as established under existing contracts? Or is he trying to achieve a “fair” outcome as he judges it, regardless of preexisting rules and agreements? I fear it may be the latter, in which case politics may start to trump the rule of law.

Mankiw has an uncanny ability to irritate me at times and although he has a bloody good point, even a vitally important point, this post did irritate me because I suspect that most bankruptcy arrangements aren’t fair, for a few reasons:

First, bond-holders, like equity holders, are ultimately speculators.  We differentiate the seniority of their claims legally, but the fact is that a guy holding a Chrysler bond is just as much of a punter as the dude holding one of the shares.  They (presumably) had the same access to information about Chrysler’s future and they (hopefully) both knew that their investment came with risk.  The idea of one subset of one factor of production being largely protected from the risk of the company’s failure is silly.

Second, employees are not speculators in the same way that the providers of capital are.  The cost of taking your money out of a company’s bonds or shares and moving it to another company is negligible.  The cost of taking your labour out and moving it to another company is significant.  At the very least, you are often geographically tied down while your money is not.  Therefore the socially optimal decision would help insure the employees against the risk of the company failing but leave the capital to insure itself.  Since US unemployment benefits (the public insurance framework) is so measly, it seems reasonable to grant employees partial access to the assets of the company.

Third, in every company to some extent (although varying depending on the industry), the employees are the company.  At an extreme, ask what a law firm would be worth if you fired all the lawyers.  Therefore, even if labour were perfectly mobile, there is a game-theoretic basis for giving the employees a stake in the game:  Principal-Agent problems exist all the way down to the floor sweepers.  This is an argument for German-style capitalism where the workers are also minority shareholders.  You might argue against workers’ representatives on the board of directors, but I do think they ought to have a share holding.

Fourth, even if all of the above balanced out to zero, there might (might!) be be beneficial social welfare to ensuring that the company is an ongoing concern rather than liquidated.  When they pushed Chrysler into bankruptcy, the hold-outs were doing so because they would get more money under liquidation than the deal on the table.  If there is a benefit to social welfare in keeping the company open, there ought to be a way to force the bond-holders to take a hefty haircut rather than liquidating the assets, even – and this is where Professor Mankiw might really get upset – if it wasn’t Pareto improving (the needs of the many …).

Nevertheless – and this is why Mankiw managed to get under my skin on this occassion – I am glad that Chrysler has gone into bankruptcy.

I am glad because even though I largely agree with the White House’s proposal, and even if my four points are all true, it is not the job of the executive to be making these decisions.    There are entire institutions set up for it.  The bankruptcy courts and the judges who preside over them specialise in this stuff.  By all means the White House might make a submission for consideration (as the executive of the country, not just as a stakeholder), but it should be up to the judge to decide.

I suspect, or at least like to imagine, that Barack Obama knows all this already (he is a constitutional lawyer, after all) and that he pushed the negotiation down the path it has taken because politically he needed to be seen to be trying to “save” Chrysler from bankruptcy and economically ne needed to avoid the market turmoil that would have ensued from a sudden move to bankruptcy rather than the tortuously gradual one we have seen.

Money multipliers and financial globalisation

Important: Much of this post is mistaken (i.e. wrong).  It’s perfectly possible for America to have an M1 money multiplier of less than one even if they were an entirely closed economy.  My apologies.  I guess that’s what I get for clicking on “Publish” at one in the morning.  A more sensible post should be forthcoming soon.  I’m leaving this here, with all its mistakes, for the sake of completeness and so that people can compare it to my proper post whenever I get around to it.

Update: You can (finally) see the improved post here.  You’ll probably still want to refer back to this one for the graphs.

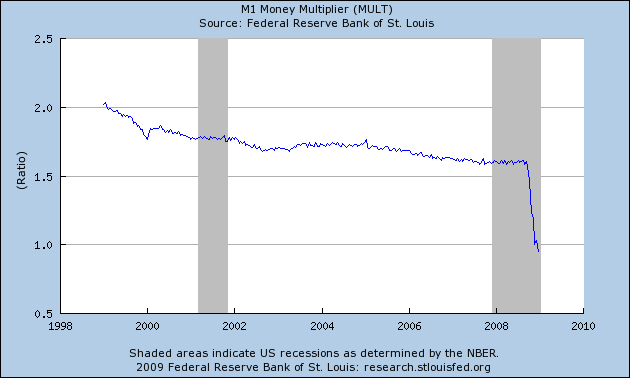
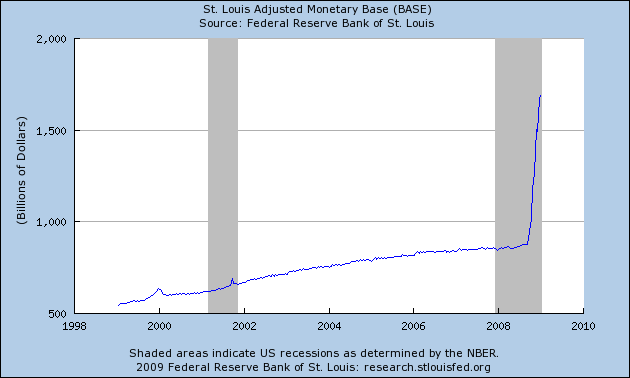
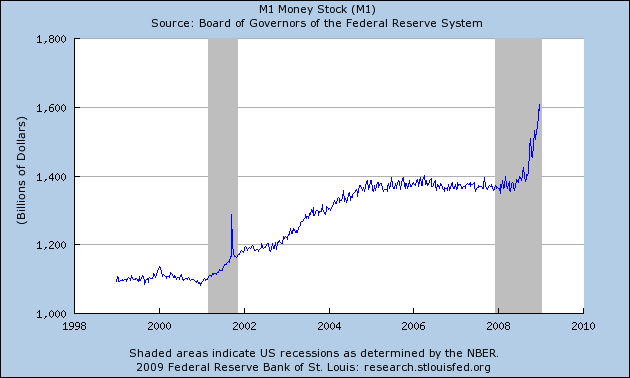
Via Greg Mankiw, I see that in the USA the M1 money multiplier has just fallen below one:

M1 Money Multiplier (USA, Accessed:  7 Jan 2009)
M1 Money Multiplier (USA, Accessed: 7 Jan 2009)

At the time of writing, the latest figure (for 17 December 2008) was 0.954.  That’s fascinating, because it should be impossible.  As far as I can tell, it has been made possible by the wonders of financial globalisation and was triggered by a decision the US Federal Reserve made at the start of October 2008.  More importantly, it means that America is paying to recapitalise some banks in other countries and while that will help them in the long run, it might be exacerbating the recessions in those countries in the short run.

Money is a strange thing.  One might think it would be easy to define (and hence, to count), but there is substantial disagreement of what qualifies as money and every central bank has their own set of definitions.  In America the definitions are (loosely):

  • M0 (the monetary base) = Physical currency in circulation + reserves held at the Federal Reserve
  • M1 = Physical currency in circulation + deposit (e.g. checking) accounts at regular banks
  • M2 = M1 + savings accounts

They aren’t entirely correct (e.g. M1 also includes travelers cheques, M2 also includes time/term deposits, etc.), but they’ll do for the moment [you can see a variety of countries’ definitions on Wikipedia].

The M1 Money Multiplier is the ratio of M1 to M0.  That is, M1 / M0.

In the normal course of events, regular banks’ reserves at the central bank are only a small fraction of the deposits they hold.  The reason is simple:  The central bank doesn’t pay interest on reserves, so they’d much rather invest (i.e. lend) the money elsewhere.  As a result, they only keep in reserve the minimum that they’re required to by law.

We therefore often think of M1 as being defined as:  M1 = M0 + deposits not held in reserve.

You can hopefully see why it should seem impossible for the M1 money multiplier to fall below 1.  M1 / M0 = (M0 + non-reserve deposits) / M0 = 1 + (non-reserve deposits / M0).  Since the non-reserve deposits are always positive, the ratio should always be greater than one.  So why isn’t it?

Step 1 in understanding why is this press release from the Federal Reserve dated 6 October 2008.  Effective from 1 October 2008, the Fed started paying interest on both required and excess reserves that regular banks (what the Fed calls “depository institutions”) held with it.  The interest payments for required reserves do not matter here, since banks had to keep that money with the Fed anyway.  But by also paying interest on excess reserves, the Fed put a floor under the rate of return that banks demanded from their regular investments (i.e. loans).

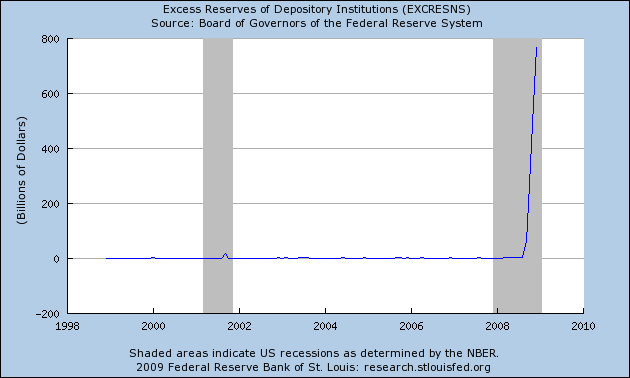
The interest rate paid on excess returns has been altered a number of times (see the press releases on 22 Oct, 5 Nov and 16 Dec), but the key point is this:  Suppose that the Fed will pay x% on excess reserves.  That is a risk-free x% available to banks if they want it, while normal investments all involve some degree of risk.  US depository institutions suddenly had a direct incentive to back out of any investment that had a risk-adjusted rate of return less than x% and to put the money into reserve instead, and boy did they jump at the chance.  Excess reserves have leapt tremendously:

Excess Reserves of Depository Institutions (USA, Accessed: 7 January 2009)
Excess Reserves of Depository Institutions (USA, Accessed: 7 Jan 2009)

Corresponding, the monetary base (M0) has soared:

Adjusted Monetary Base (USA, Accessed: 7 Jan 2009)

If we think of M1 as being M1 = M0 + non-reserve deposits, then we would have expected M1 to increase by similar amounts (a little under US$800 billion).  In reality, it’s only risen by US$200 billion or so:

M1 Money Supply (USA, Accessed: 7 Jan 2009)
M1 Money Stock (USA, Accessed: 7 Jan 2009)

So where have the other US$600 billion come from?  Other countries.

Remember that the real definition of M1 is M1 = Physical currency in circulation + deposit accounts.  The Federal Reserve, when calculating M1, only looks at deposits in America.

By contrast, the definition of the monetary base is M0 = Physical currency in circulation + reserves held at Federal Reserve.  The Fed knows that those reserves came from American depository institutions, but it has no idea where they got it from.

Consider Citibank.  It collects deposits from all over the world, but for simplicity, imagine that it only collects them in America and Britain.  Citibank-UK will naturally keep a fraction of British deposits in reserve with the Bank of England (the British central bank), but it is free to invest the remainder wherever it likes, including overseas.  Since it also has an arm in America that is registered as a depository institution, putting that money in reserve at the Federal Reserve is an option.

That means that, once again, if Citibank-UK can’t get a risk-adjusted rate of return in Britain that is greater than the interest rate the Fed is paying on excess reserves, it will exchange the British pounds for US dollars and put the money in reserve at the Fed.  The only difference is that the risk will now involve the possibility of exchange-rate fluctuations.

It’s not just US-based banks with a presence in other countries, though.  Any non-American bank that has a branch registered as a depository institution in America (e.g. the British banking giant, HSBC) has the option of changing their money into US dollars and putting them in reserve at the Fed.

So what does all of that mean?  I see two implications:

  1. Large non-American banks that have American subsidiaries are enjoying the free money that the Federal Reserve is handing out.  By contrast, smaller non-American banks that do not have American subsidiaries are not able to access the Federal Reserve system and so are forced to find other investments.
  2. The US$600+ billion of foreign money currently parked in reserve at the Fed had to come out of the countries of origin, meaning that it is no longer there to stimulate their economies.  By starting to pay interest on excess reserves, the US Federal Reserve effectively imposed an interest rate increase on other countries.

ORLY?

Dear Michael Medved (who wrote the article and who graduated from Yale) and Professor Greg Mankiw (who linked to the article and teaches at Harvard),

I’m willing to accept that Michael’s argument represents some of the reason why Harvard and Yale graduates represent such a large fraction of presidential candidates if you are willing to accept that it is almost certainly a minor reason.

Ignoring your implied put-down of all of the other top-ranked universities in the United States, not to mention the still-excellent-but-not-Ivy-League institutions, the first thing that leaps to mind is the idea of (shock!) a third event that causally influences both Yale/Harvard attendance and entry into politics.

Perhaps the wealth of a child’s family is a good predictor of both whether that child will get into Harvard/Yale and also of whether they get into the “worth considering” pool of presidential candidates?

Perhaps there are some politics-specific network effects, with attendance at your esteemed universities being simply an opportunity to meet the parents of co-students?

Perhaps students who attend Harvard/Yale are self-selecting, with students interested in a career in politics being overly represented in your universities’ applicant pools?

Perhaps the geography matters, with universities located in the North East of the United States being over-represented in federal politics even after allowing for the above?

For the benefit of readers, here is the relevant section of the article:

What’s the explanation for this extraordinary situation – with Yale/Harvard degree-holders making up less than two-tenths of 1% of the national population, but winning more than 83% of recent presidential nominations?…

Today, the most prestigious degrees don’t so much guarantee success in adulthood as they confirm success in childhood and adolescence. That piece of parchment from New Haven or Cambridge doesn’t guarantee you’ve received a spectacular education, but it does indicate that you’ve competed with single-minded effectiveness in the first 20 years of life.

And the winners of that daunting battle – the driven, ferociously focused kids willing to expend the energy and make the sacrifices to conquer our most exclusive universities – are among those most likely to enjoy similar success in the even more fiercely fought free-for-all of presidential politics.

Believing the “experts”

One of my favourite topics – indeed, in a way, the basis of my current research – is looking at how we tend to accept the declarations of other people as true without bothering to think on the issue for ourselves.  This is often a perfectly rational thing to do, as thinking carefully about things is both difficult and time consuming, often resulting in several possible answers that serve to increase our confusion, not lessen it.  If we can find somebody we trust to do the thinking for us and then tell us their conclusions, that can leave us free to put our time to work in other areas.

The trick is in that “trust” component.  To my mind, we not only tend to accept the views of people widely accepted to be experts, but also of anybody that we believe knows more than us on the topic.  This is one of the key reasons why I am not convinced by the “wisdom of crowds” theory and it’s big brother in financial markets, the efficient market hypothesis. I’m happy to accept that they might work when individual opinions are independent of each other, but they rarely are.

Via Greg Mankiw, I’ve just discovered a fantastic example of a person who is not an expert on a topic, but definitely more knowledgeable than most people, who nevertheless got something entirely wrong.  The person is Mark Hulbert, who is no slouch in the commentary department. Here is his article over at MarketWatch:

I had argued in previous columns that inflation might not be heating up, despite evidence to the contrary from lots of different sources …

I had based my argument on the narrowing yield spread between regular Treasury bonds and the special type of Treasuries known as TIPS. The only apparent difference between these two kinds of Treasury securities is that TIPS’ interest rates are protected against changes in the inflation rate. So I had assumed that we can deduce the bond market’s expectations of future inflation by comparing their yields.

… My argument appeared to make perfect sense, and I certainly was not the only one that was making it. But I now believe that I was wrong. Interpreted correctly, the message of the bond market actually is that inflation is indeed going up.

… My education came courtesy of Stephen Cecchetti, a former director of research at the New York Fed and currently professor of global finance at Brandeis University. In an interview, Cecchetti pointed out that other factors must be introduced into the equation when deducing the market’s inflationary expectations from the spread between the yields on TIPS and regular Treasuries.

The most important of these other factors right now is the relative size of the markets for TIPS and regular Treasury securities. Whereas the market for the latter is huge — larger, in fact, than the equity market — the TIPS market is several orders of magnitude smaller. This means that, relative to regular Treasuries, TIPS yields must be higher to compensate investors for this relative illiquidity.

And that, in turn, means that the spread between the yields on regular Treasuries and TIPS will understate the bond market’s expectations of future inflation.

Complicating factors even more is that this so-called illiquidity premium is not constant. So economists have had to devise elaborate econometric models to adjust for it and other factors. And those models are showing inflationary expectations to have dramatically worsened in recent months.

I have never met Mr. Hulbert, nor read any of his other articles.  I cannot claim that I wouldn’t have made the same mistake and I have to tip my hat to him for being willing to face up to it.  There are remarkably few people who would do that.

On mathematics (and modelling) in economics

Again related to my contemplation of what defines and how to shift mainstream thinking in economics, I was happy to find a few comments around the traps on the importance of mathematics (and the modelling it is used for) in economics.

Greg Mankiw lists five reasons:

  1. Every economist needs to have a solid foundation in the basics of economic theory and econometrics [and] you cannot get this … without understanding the language of mathematics that these fields use.
  2. Occasionally, you will need math in your job.
  3. Math is good training for the mind. It makes you a more rigorous thinker.
  4. Your math courses are one long IQ test. We use math courses to figure out who is really smart.
  5. Economics graduate programs are more oriented to training students for academic research than for policy jobs … [As] academics, we teach what we know.

It’s interesting to note that he doesn’t include the usefulness of mathematics specifically as an aid to understanding the economy, but rather focuses on it’s ability to enforce rigour in one’s thinking and (therefore) act as a signal of a one’s ability to think logically. It’s also worth noting his candor towards the end:

I am not claiming this is optimal, just reality.

I find it difficult to believe that mathematics serves as little more than a signal of intelligence (or at least rigorous thought). Simply labelling mathematics as the peacock’s tail of economics does nothing to explain why it was adopted in the first place or why it is still (or at least may still be) a useful tool.

Dani Rodrik’s view partially addresses this by expanding on Mankiw’s third point:

[I]f you are smart enough to be a Nobel-prize winning economist maybe you can do without the math, but the rest of us mere mortals cannot. We need the math to make sure that we think straight–to ensure that our conclusions follow from our premises and that we haven’t left loose ends hanging in our argument. In other words, we use math not because we are smart, but because we are not smart enough.

It’s a cute argument and a fair stab at explaining the value of mathematics in and of itself. However, the real value of Rodrik’s post came from the (public) comments put up on his blog, to which he later responded here. I especially liked these sections (abbridged by me):

First let me agree with robertdfeinman, who writes:

I’m afraid that I feel that much of the more abstruse mathematical models used in economics are just academic window dressing. Cloistered fields can become quite introspective, one only has to look at English literature criticism to see the effect.

“Academic window dressing” indeed. God knows there is enough of that going on. But I think one very encouraging trends in economics in the last 15 years or so is that the discipline has become much, much more empirical. I discussed this trend in an earlier post. I also agree with … peter who says

My experience is that high tech math carries a cachet in itself across much of the profession. This leads to a sort of baroque over-ornamentation at best and, even worse, potentially serious imbalances in the attention given to different types of information and concepts.

All I can say is that I hope I have never been that kind of an economist … Jay complains:

What about the vast majority of people out there–the ones who are not smart enough to grasp the math? I guess they will never understand development. Every individual that hasn’t had advanced level training in math should be automatically disqualified from having a strong opinion on poverty and underdevelopment. Well, that’s just about most of the world, including nearly all political leaders in the developing world. Let’s leave the strong opinions to the humble economists, the ones who realize that they’re not smart enough.

I hate to be making an argument that may be construed as elitist, but yes, I do believe there is something valuable called “expertise.” Presumably Jay would not disagree that education is critical for those who are going to be in decision-making positions. And if so, the question is what that education should entail and the role of math in it.

I find resonance with this last point of Rodrik’s. To criticise the use of mathematics just because you don’t understand it is no argument at all. Should physics as a discipline abandon mathematics just because I don’t understand all of it?

As a final point, I came across an essay by Paul Krugman, written in 1994: “The fall and rise of development economics.” He is speaking about a particular idea within development economics (increasing returns to scale and associated coordination problems), but his thoughts relate generally to the use of mathematically-rigorous modelling in economics as a whole:

A friend of mine who combines a professional interest in Africa with a hobby of collecting antique maps has written a fascinating paper called “The evolution of European ignorance about Africa.” The paper describes how European maps of the African continent evolved from the 15th to the 19th centuries.

You might have supposed that the process would have been more or less linear: as European knowledge of the continent advanced, the maps would have shown both increasing accuracy and increasing levels of detail. But that’s not what happened. In the 15th century, maps of Africa were, of course, quite inaccurate about distances, coastlines, and so on. They did, however, contain quite a lot of information about the interior, based essentially on second- or third-hand travellers’ reports. Thus the maps showed Timbuktu, the River Niger, and so forth. Admittedly, they also contained quite a lot of untrue information, like regions inhabited by men with their mouths in their stomachs. Still, in the early 15th century Africa on maps was a filled space.

Over time, the art of mapmaking and the quality of information used to make maps got steadily better. The coastline of Africa was first explored, then plotted with growing accuracy, and by the 18th century that coastline was shown in a manner essentially indistinguishable from that of modern maps. Cities and peoples along the coast were also shown with great fidelity.

On the other hand, the interior emptied out. The weird mythical creatures were gone, but so were the real cities and rivers. In a way, Europeans had become more ignorant about Africa than they had been before.

It should be obvious what happened: the improvement in the art of mapmaking raised the standard for what was considered valid data. Second-hand reports of the form “six days south of the end of the desert you encounter a vast river flowing from east to west” were no longer something you would use to draw your map. Only features of the landscape that had been visited by reliable informants equipped with sextants and compasses now qualified. And so the crowded if confused continental interior of the old maps became “darkest Africa”, an empty space.

Of course, by the end of the 19th century darkest Africa had been explored, and mapped accurately. In the end, the rigor of modern cartography led to infinitely better maps. But there was an extended period in which improved technique actually led to some loss in knowledge.

Between the 1940s and the 1970s something similar happened to economics. A rise in the standards of rigor and logic led to a much improved level of understanding of some things, but also led for a time to an unwillingness to confront those areas the new technical rigor could not yet reach. Areas of inquiry that had been filled in, however imperfectly, became blanks. Only gradually, over an extended period, did these dark regions get re-explored.

Economics has always been unique among the social sciences for its reliance on numerical examples and mathematical models. David Ricardo’s theories of comparative advantage and land rent are as tightly specified as any modern economist could want. Nonetheless, in the early 20th century economic analysis was, by modern standards, marked by a good deal of fuzziness. In the case of Alfred Marshall, whose influence dominated economics until the 1930s, this fuzziness was deliberate: an able mathematician, Marshall actually worked out many of his ideas through formal models in private, then tucked them away in appendices or even suppressed them when it came to publishing his books. Tjalling Koopmans, one of the founders of econometrics, was later to refer caustically to Marshall’s style as “diplomatic”: analytical difficulties and fine points were smoothed over with parables and metaphors, rather than tackled in full view of the reader. (By the way, I personally regard Marshall as one of the greatest of all economists. His works remain remarkable in their range of insight; one only wishes that they were more widely read).

High development theorists followed Marshall’s example. From the point of view of a modern economist, the most striking feature of the works of high development theory is their adherence to a discursive, non-mathematical style. Economics has, of course, become vastly more mathematical over time. Nonetheless, development economics was archaic in style even for its own time.

So why didn’t high development theory get expressed in formal models? Almost certainly for one basic reason: high development theory rested critically on the assumption of economies of scale, but nobody knew how to put these scale economies into formal models.

I find this fascinating and a compelling explanation for how (or rather, why) certain ideas seemed to “go away” only to be rediscovered later on. It also suggests an approach for new researchers (like I one day hope to be) in their search for ideas. It’s not a new thought, but it bears repeating: Look for ideas outside your field, or at least outside the mainstream of your field, and find a way to express them in the language of your mainstream. This is, in essence, what the New Keynesians have done by bringing the heterodox into the New Classical framework.

Krugman goes on to speak of why mathematically-rigorous modelling is so valuable:

It is said that those who can, do, while those who cannot, discuss methodology. So the very fact that I raise the issue of methodology in this paper tells you something about the state of economics. Yet in some ways the problems of economics and of social science in general are part of a broader methodological problem that afflicts many fields: how to deal with complex systems.

I have not specified exactly what I mean by a model. You may think that I must mean a mathematical model, perhaps a computer simulation. And indeed that’s mostly what we have to work with in economics.

The important point is that any kind of model of a complex system — a physical model, a computer simulation, or a pencil-and-paper mathematical representation — amounts to pretty much the same kind of procedure. You make a set of clearly untrue simplifications to get the system down to something you can handle; those simplifications are dictated partly by guesses about what is important, partly by the modeling techniques available. And the end result, if the model is a good one, is an improved insight into why the vastly more complex real system behaves the way it does.

When it comes to physical science, few people have problems with this idea. When we turn to social science, however, the whole issue of modeling begins to raise people’s hackles. Suddenly the idea of representing the relevant system through a set of simplifications that are dictated at least in part by the available techniques becomes highly objectionable. Everyone accepts that it was reasonable for Fultz to represent the Earth, at least for a first pass, with a flat dish, because that was what was practical. But what do you think about the decision of most economists between 1820 and 1970 to represent the economy as a set of perfectly competitive markets, because a model of perfect competition was what they knew how to build? It’s essentially the same thing, but it raises howls of indignation.

Why is our attitude so different when we come to social science? There are some discreditable reasons: like Victorians offended by the suggestion that they were descended from apes, some humanists imagine that their dignity is threatened when human society is represented as the moral equivalent of a dish on a turntable. Also, the most vociferous critics of economic models are often politically motivated. They have very strong ideas about what they want to believe; their convictions are essentially driven by values rather than analysis, but when an analysis threatens those beliefs they prefer to attack its assumptions rather than examine the basis for their own beliefs.

Still, there are highly intelligent and objective thinkers who are repelled by simplistic models for a much better reason: they are very aware that the act of building a model involves loss as well as gain. Africa isn’t empty, but the act of making accurate maps can get you into the habit of imagining that it is. Model-building, especially in its early stages, involves the evolution of ignorance as well as knowledge; and someone with powerful intuition, with a deep sense of the complexities of reality, may well feel that from his point of view more is lost than is gained. It is in this honorable camp that I would put Albert Hirschman and his rejection of mainstream economics.

The cycle of knowledge lost before it can be regained seems to be an inevitable part of formal model-building. Here’s another story from meteorology. Folk wisdom has always said that you can predict future weather from the aspect of the sky, and had claimed that certain kinds of clouds presaged storms. As meteorology developed in the 19th and early 20th centuries, however — as it made such fundamental discoveries, completely unknown to folk wisdom, as the fact that the winds in a storm blow in a circular path — it basically stopped paying attention to how the sky looked. Serious students of the weather studied wind direction and barometric pressure, not the pretty patterns made by condensing water vapor.

It was not until 1919 that a group of Norwegian scientists realized that the folk wisdom had been right all along — that one could identify the onset and development of a cyclonic storm quite accurately by looking at the shapes and altitude of the cloud cover.

The point is not that a century of research into the weather had only reaffirmed what everyone knew from the beginning. The meteorology of 1919 had learned many things of which folklore was unaware, and dispelled many myths. Nor is the point that meteorologists somehow sinned by not looking at clouds for so long. What happened was simply inevitable: during the process of model-building, there is a narrowing of vision imposed by the limitations of one’s framework and tools, a narrowing that can only be ended definitively by making those tools good enough to transcend those limitations.

But that initial narrowing is very hard for broad minds to accept. And so they look for an alternative.

The problem is that there is no alternative to models. We all think in simplified models, all the time. The sophisticated thing to do is not to pretend to stop, but to be self-conscious — to be aware that your models are maps rather than reality.

There are many intelligent writers on economics who are able to convince themselves — and sometimes large numbers of other people as well — that they have found a way to transcend the narrowing effect of model-building. Invariably they are fooling themselves. If you look at the writing of anyone who claims to be able to write about social issues without stooping to restrictive modeling, you will find that his insights are based essentially on the use of metaphor. And metaphor is, of course, a kind of heuristic modeling technique.

In fact, we are all builders and purveyors of unrealistic simplifications. Some of us are self-aware: we use our models as metaphors. Others, including people who are indisputably brilliant and seemingly sophisticated, are sleepwalkers: they unconsciously use metaphors as models.

Brilliant stuff.
Volatility and the value of historical context

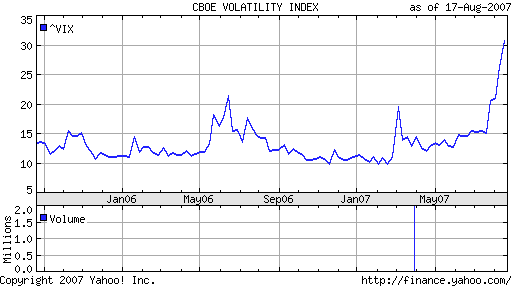
Greg Mankiw has a brief note (I’ll include it verbatim):

This is the VIX index, which uses options prices to measure expected stock market volatility over the next 30 days. The latest run-up is striking. It suggests that the recent bumpy ride in financial markets is likely to continue for a while.

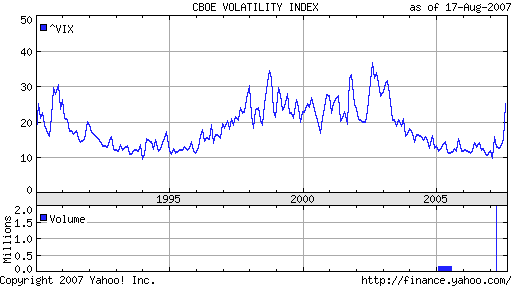
I had never heard of the VIX Index before (yet another thing to add to the shamefully-ignorant-about pile), but I do notice that while the 2-year graph Prof. Mankiw includes makes the current turmoil look unprecedented, it’s actually nothing of the sort. Here’s the same graph over the maximum possible period:

Looking at this, the recent brouhaha is certainly serious, but is also certainly no worse (yet) than we’ve had before. The LTCM (1998) and 9/11 (2001) events are clearly discernible. Other than those two, I have no idea why volatility was so high between 1997 and 2003, or why it spiked in 1990 (something to do with the then-upcoming recession?).