Approximating a demand function with shocks to the elasticity of demand

Entirely for my own reference …

A demand function commonly used in macroeconomics is the following, derived from a Dixit-Stiglitz aggregator and exhibiting a constant own-price elasticity of demand ($$\gamma$$):

$$!Q_{it}=\left(\frac{P_{it}}{P_{t}}\right)^{-\gamma}Q_{t}$$

A demand-side shock can then be modelled as a change in the elasticity of demand:

$$!Q_{it}=\left(\frac{P_{it}}{P_{t}}\right)^{-\gamma D_{t}}Q_{t}$$

Where $$\ln\left(D_{t}\right)$$ is, say, Normally distributed and plausibly autocorrelated.  We can rewrite this as a function of (natural) log deviations from long-run trends:

$$!Q_{it}=\overline{Q_{t}}e^{q_{t}-\gamma e^{d_{t}}\left(p_{it}-p_{t}\right)}$$

Where:

  • Variables with a bar above them are long-run trends:  $$\overline{X_{it}}$$
  • Lower-case variables are natural log deviations from their long run trends (so that for small deviations, they may be thought of as the percentage difference from trend):  $$x_{it}=\ln\left(X_{it}\right)-\ln\left(\overline{X_{it}}\right)$$
  • The long-run trend of all prices is to equal the aggregate price:  $$\overline{P_{it}}=\overline{P_{t}}$$
  • The long-run trend of $$D_{t}$$ is unity

We’ll construct a quadratic approximation around $$q_{t}=p_{it}=p_{t}=d_{t}=0$$ but, first, a table of partial derivatives for a more general function:

Function Value at $$x=y=z=0$$
$$f\left(x,y,z\right)=ae^{x+bye^{z}}$$ $$a$$
$$f_{x}\left(x,y,z\right)=ae^{x+bye^{z}}$$ $$a$$
$$f_{y}\left(x,y,z\right)=abe^{x+bye^{z}+z}$$ $$ab$$
$$f_{z}\left(x,y,z\right)=abye^{x+bye^{z}+z}$$ $$0$$
$$f_{xx}\left(x,y,z\right)=ae^{x+bye^{z}}$$ $$a$$
$$f_{yy}\left(x,y,z\right)=ab^{2}e^{x+bye^{z}+2z}$$ $$ab^{2}$$
$$f_{zz}\left(x,y,z\right)=abye^{x+bye^{z}+z}+ab^{2}y^{2}e^{x+bye^{z}+2z}$$ $$0$$
$$f_{xy}\left(x,y,z\right)=abe^{x+bye^{z}+z}$$ $$ab$$
$$f_{xz}\left(x,y,z\right)=abye^{x+bye^{z}+z}$$ $$0$$
$$f_{yz}\left(x,y,z\right)=abe^{x+bye^{z}+z}+ab^{2}ye^{x+bye^{z}+2z}$$ $$ab$$

So that in the vicinity of $$x=y=z=0$$, the function $$f\left(x,y,z\right)$$ is approximated by:

$$!f\left(x,y,z\right)\simeq a + a\left(x+by\right) + a\left[\frac{1}{2}\left(x+by\right)^{2}+byz\right]$$

From which we can infer that:

$$!Q_{it}\simeq \overline{Q_{t}}\left[1+\left(q_{t}-\gamma\left(p_{it}-p_{t}\right)\right) + \frac{1}{2}\left(q_{t}-\gamma\left(p_{it}-p_{t}\right)\right)^{2}-\gamma\left(p_{it}-p_{t}\right)d_{t}\right]$$

If introduced to a profit function, the first-order components ($$q_{t}-\gamma\left(p_{it}-p_{t}\right)$$) would vanish as individual prices will be optimal in the long run.

Update (20 Jan 2010): Added the half in each of the last equations.
VW: Supply, Demand and Elasticity

Something very interesting happened to the share price of Volkswagen this week.  The FT has the story:

Volkswagen’s shares more than doubled on Monday after Porsche moved to cement its control of Europe’s biggest carmaker and hedge funds, rushing to cover short positions, were forced to buy stock from a shrinking pool of shares in free float.

VW shares rose 147 per cent after Porsche unexpectedly disclosed that through the use of derivatives it had increased its stake in VW from 35 to 74.1 per cent.

[T]he sudden disclosure meant there was a free float of only 5.8 per cent – the state of Lower Saxony owns 20.1 per cent – sparking panic among hedge funds. Many had bet on VW’s share price falling and the rise on Monday led to estimated losses among them of €10bn-€15bn ($12.5bn-$18.8bn).

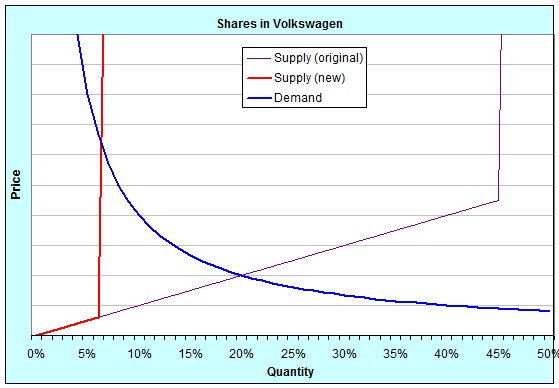
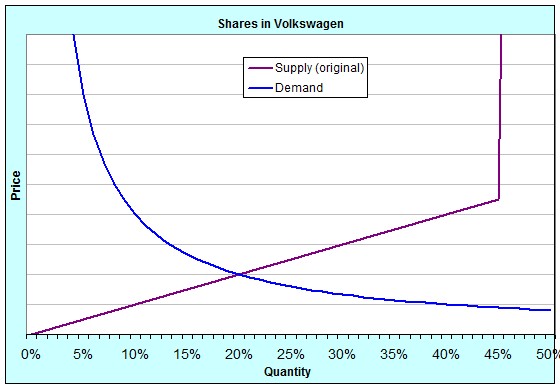
For my students in EC102, this is interesting because of the shifts in Supply and Demand and the elasticity of those curves.  The buying and selling of shares in companies is a market just like any other.  Here’s an idea of what the Supply and Demand curves for shares in Volkswagen were originally:

Shares in Volkswagen (original)

The quantity is measured as a percentage because you can only ever buy up to 100% of a company.  Notice that the supply curve suddenly rockets upwards at around 45%.  That’s because originally, 55% of the shares of Volkswagen weren’t available for sale.  20% was owned by the state of Lower Saxony and 35% by Porsche, and they weren’t willing to sell at any price [In reality, if you were to offer them enough money, they might have been willing to sell some of their shares, but the point is that it would have had to have been a lot].  We say that for quantities above 45%, the supply of shares was highly, even perfectly, inelastic.

Notice, too, that the demand curve is also extremely inelastic at quite low quantities.  That is because a lot of hedge funds had shorted the VW stock.  Shorting (sometimes called “short selling” or “going short”) is when the investor borrows shares they don’t own in order to sell them at today’s price.  When it comes time to return them, they will buy them on the open market and give them back.  If the price falls over that time, they make money, pocketing the difference between the price they sold at originally and the price they bought at eventually.  A lot of hedge funds were in that in-between time.  They had borrowed and sold the shares, and were then hoping that the price would fall.  The demand at very low quantities was inelastic because they had to buy shares to pay back whoever they’d borrowed them from, no matter which way the price moved or how far.

On Monday, Porsche surprised everybody by announcing that they had (through the use of derivatives like warrants and call options), increased their not-for-sale stake from 35% to a little over 74%.  This meant that instead of 45% of the shares being available for sale on the open market, only 6% were.  It was a shift in the supply curve, like this:

Shares in Volkswagen (new)

Because at such low quantities both supply and demand were very inelastic, the price jumped enormously.  Last week, the price finished on Friday at roughly €211 per share.  By the close of trading on Monday, it had reached €520 per share.  At the close of trading on Tuesday, it was €945 per share.  In fact, during the day on Tuesday it at one point reached €1005 per share, temporarily making it the largest company in the world by market capitalisation!

Who said that first-year economics classes aren’t fun?

The exponential rise of bureaucracy

Bureaucracy has been getting worse for years. Bigger, more complex, more self-referential, self-justifying, self-absorbed. More impenetrable. The language of bureaucracy has been changing as some sort of linguistic mirror of the organisation itself. It has happened in the public service at all three levels and in the private sector. It has happened in every industry. Why? My current thoughts, in three slightly overlapping points:

Point 1) The distribution of demand across skills and abilities has been changing. As we’ve moved away from agriculture, through manufacturing and towards services and office work, the need for administrative, bureaucratic tasks has increased.

Point 2) The distribution of task-related ability across the population has not changed, or at least has not changed much. There might be more people going to university, but there are limits to how much education can enhance a person’s innate ability.

Point 3) (a) A high-ability person will get more done than a low-ability person, irrespective of their coworkers.

Point 3) (b) The productivity of a person is influenced by the ability of their co-workers, so that high-ability coworkers will raise your productivity and low-ability coworkers will lower your productivity.

Point 3) (c) There is an optimal size to a team. Even if everyone is of equal ability, per-person productivity will (initially) rise with the size of the team, peak, and then start to fall.

Points 1 and 2 mean that the need for bureaucratic work is increasing, but the number of people needed to do that work is increasing faster because the ability of the marginal (new) bureaucrat is less than the average ability of the existing bureaucratic workforce. Point 3 means that the gap between these two growth rates increases as the demand for bureaucratic work increases. As an illustration, I imagine the demand for bureaucratic tasks increasing linearly, but the size of the bureaucracy (and the inner complexity of it) needed to provide this service increasing exponentially.

How do we fight this? I see three ways:

a) Try harder to shift the distribution of ability over the population. The Aust/UK governments are aware of this, but have unfortunately settled for simply lowering the bar for getting into university. A generous commentator might acknowledge that they had the best intentions at heart, but the end result is one set of numbers going up, the value of those numbers going down and the problem remaining the same. Seriously working to address the problem via this tack — if it can be done from this angle at all — could only be done over a timeframe of 20+ years.

b) Work to slow (or, ideally, reverse) the increasing demand for bureaucratic work in the first place. Cut red tape. Stop trying to watch, record, register and regulate everything. Remove overlap.

c) Decrease bureaucratic team sizes. Make them specialise. Specifically link bureaucratic teams to the end-consumers that they are nominally serving.

Aggregate demand for the spiritual (updated)

Adam (sans-blog, but when he bothers, he writes at the South Sea Republic) pointed me to this article at The Guardian. All we need to know comes from the opening sentence:

After a break of 16 centuries, Greek pagans are worshipping the ancient gods again – despite furious opposition from the Orthodox church.

Is there a link between the rise of modern-day paganism, astrology, homoeopathic medicine etc. and the hardening of mainstream religions? If so, does one cause the other, or are they both caused by a third factor?

I wonder if it might be possible to develop some sort of measure of a country’s aggregate demand for the spiritual. You might do it by adding up all the money spent on them (including donations to religious bodies) and then adding in the value of the time spent attending religious services and festivals. I guess you could derive the latter by looking at attendance numbers, knowing something about the average duration of services and making an estimate of the value of leisure-time.

If it was feasible, you’d be able to infer answers to several questions:

The proportional break-down of the “spending” might give a truer estimate of the distribution of religious belief in society than census data … in essence, we would be looking at revealed preference rather than stated preference.

If aggregate demand for the spiritual were changing over time, that might indicate a demographic shift (from immigration, say) or — and this would be more interesting — it might provide a measure of movements in dissatisfaction with life in general. For example, a trend of decreasing demand might indicate that people are becoming more satisfied with life, or at least that they are able to find what they want in the temporal world without needing to turn to the spiritual.

*sigh* So little time, so many pointless things to waste my time thinking about.

Update 1:

Adam read this and interpreted it as my suggesting that as people become richer, they become less religious. Rereading it, I guess that’s a fair interpretation, but it’s not what I meant at all. My current suspicion is that, on the whole, demand for the spiritual has remained remarkably constant over the years. With absolutely no figures to back it up, I reckon that aggregate demand in Australia reached a low-point in the early ’80s, increased steadily and has largely stabilised since the turn of the century. I think that the aggregate demand now is much closer to historical trend levels and that the early ’80s represented a temporary low point. I also think that the reversion-to-the-mean that we’ve seen over the last 30 years has not come from a return to 1950s-style religion, but from a general embrace of smaller aspects of spirtuality coupled with nostalgic, idealised views of the distant past and an increasing distrust of authority and “the system”. The diversity that ensued has therefore seen the rise (or perhaps more accurately, the return) of stuff like paganism and astrology, coupled with attempts to merge these small-scale, anti-establishment religious views with pop science in the form of stuff like “What the bleep do we know?” and so forth.

I’ve heard this latter stuff described as “quasi-religious” and to some extent, I agree. To the extent that they’re not codified, formalised or doctrinal, they’re only quasi-religious; but on the whole, I think that it still represents the same underlying desire for the spiritual that existed in the 1950s, simply expressed in a different form. So in that sense, there’s nothing “quasi” about it … it’s just “religious.”

Assuming that I’m correct in my gut-feel for the figures (which is why I’d love to find some proper figures instead of randomly waving my hands in the air), all of this just raises the questions of a) why is the demand there in general? and b1) why did it drop in the early ’80s? or b2) why, after dropping in the early ’80s, has it come back?