Once more on bankers’ pay

Megan McArdle makes a perfectly sensible point when she writes:

More than one smart analyst thinks that the yearly bonus regime encouraged both traders and their managers to take excess risk. I’m not sure, as an empircal matter, that I buy this argument. Most of those bankers who were allegedly gambling for free with (implicit) taxpayer money in fact lost half or more of their own fortunes in the ensuing crash. From this I infer that they did not, in fact, realize that they were gambling.

I still think that some regulation on bonuses is warranted. Indeed, I think it warranted precisely because the bankers didn’t fully appreciate the risks they were taking. By holding bonuses in escrow for, say, five years, we serve to increase the risk aversion of those bankers.  Megan implies partial agreement with the conclusion, if not the logic, a little later on:

But enforcing, say, a multi-year bonus scheme wouldn’t be terribly destructive, and it might help.

Continuing immediately on, she writes:

On the other hand, if the government starts meddling with the level of compensation, this will be disturbing both because it will not do good things for the American financial services industry, and because, well, who the hell is the government to start telling private firms that are not receiving any taxpayer money how much to pay their employees?

In general I’d agree, but we should also consider the recent work by Thomas Philippon and Ariell Reshef suggesting that remuneration in the finance sector relative to the rest of the economy for a given level of education has been especially high lately.  Here is an ungated version of their paper.  Here is the abstract:

We use detailed information about wages, education and occupations to shed light on the evolution of the U.S. financial sector over the past century. We uncover a set of new, interrelated stylized facts: financial jobs were relatively skill intensive, complex, and highly paid until the 1930s and after the 1980s, but not in the interim period. We investigate the determinants of this evolution and find that financial deregulation and corporate activities linked to IPOs and credit risk increase the demand for skills in financial jobs. Computers and information technology play a more limited role. Our analysis also shows that wages in finance were excessively high around 1930 and from the mid 1990s until 2006. For the recent period we estimate that rents accounted for 30% to 50% of the wage differential between the financial sector and the rest of the private sector. [emphasis added]

… which is prima facie evidence in support of some sort of regulation on remuneration in the finance sector.

Is America recapitalising all the non-American banks?

The recent naming of the AIG counterparties [press release, NY Times coverage] reminded me of something and this post by Brad Setser has inspired me to write on it.

Back in January, I wrote a post that contained some mistakes.  I argued that part of the reason that the M1 money multiplier in America fell below unity was because foreign banks with branches in America and American banks with branches in other countries were taking deposits from other countries and placing them in (excess) reserve at the Federal Reserve.

My first mistake was in believing that that was the only reason why the multiplier fell below one.  Of course, even if the United States were in a state of autarky it could still fall below one as all it requires is that banks withdraw from investments outside the standard definitions of money and place the proceeds in their reserve account at the Fed.

And that was certainly happening, because by paying interest on excess reserves, the Fed placed a floor under the risk-adjusted return that banks would insist on receiving for any investment.  Any position with a risk-free-equivalent yield that was less than what the Fed was paying was very rapidly unwound.

Nevertheless, I believe that my idea still applies in part.  By paying interest on excess reserves, the Fed (surely?) also placed a floor under the risk-adjusted returns for anybody with access to a US depository institution, including foreign branches of US banks and foreign banks with branches in America.  The only difference is that those groups would also have had exchange-rate risk to incorporate.  But since the US dollar enjoys reserve currency status, it may have seemed a safe bet to assume that the USD would not fall while the money was in America at the Fed because of the global flight to quality.

The obvious question is to then ask how much money held in (excess) reserve at the Fed originated from outside of America.  Over 2008:Q4, the relevant movements were: [1]

Remember that, roughly speaking, the definitions are:

  • monetary base = currency + required reserves + excess reserves
  • m1 = currency + demand deposits

So we can infer that next to the $707 billion increase in excess reserves, demand deposits only increased by $148 billion and required reserves by $7 billion.

In a second mistake in my January post, I thought that it was the difference in growth between m1 and the monetary base that needed explaining.  That was silly.  Strictly speaking it is the entirety of the excess reserve growth that we want to explain.  How much was from US banks unwinding domestic positions and how much was from foreigners?

Which is where we get to Brad’s post.  In looking at the latest Flow of Funds data from the Federal Reserve, he noted with some puzzlement that over 2008:Q4 for the entire US banking system (see page 69 of the full pdf):

  • liabilities to domestic banks (floats and discrepancies in interbank transactions) went from $-50.9 billion to $-293.4 billion.
  • liabilities to foreign banks went from $-48.1 billion to $289.5 billion

I’m not sure about the first of those, but on the second that represents a net loan of $337.6 billion from foreign banks to US banks over that last quarter.

Could that be foreign banks indirectly making use of the Fed’s interest payments on excess reserves?

No matter what the extent of foreign banks putting money in reserve with the Fed, that process – together with the US government-backed settlements of AIGs foolish CDS contracts – amounts to America (partially) recapitalising not just its own, but the banking systems of the rest of the world too.

[1] M1 averaged 1435.1 in September and 1624.7 in December.  Monetary base averaged 936.138 in September and 1692.511 in December.  Currency averaged 776.7 in September and 819.0 in December. Excess reserves averaged 60.051 in September and 767.412 in December.  Remember that the monthly figures released by the Federal Reserve are dated at the 1st of the month but are actually an average for the whole of the month.

US February Employment and Recession vs. Depression

The preliminary employment data for February in the USA has been out for a little while now and I thought it worthwhile to update the graphs I did after January’s figures.

As I explained when producing the January graphs, I believe that it’s more representative to look at Weekly Hours Worked Per Capita than at just the number of people with jobs so as to more fully take into account part-time work, the entry of women into the labour force and the effects of discouraged workers.  Graphs that only look at total employment (for example: 1, 2) paint a distorted picture.

The Year-over-Year percentage changes in the number of employed workers, the weekly hours per capita and the weekly hours per workforce member continue to worsen.  The current recession is still not quite as bad as that in 1981/82 by this measure, but it’s so close as to make no difference.

Year-over-year changes in employment and hours worked

Just looking at year-over-year figures is a little deceptive, though, as it’s not just how far below the 0%-change line you fall that matters, but also how long you spend below it.  Notice, for example, that while the 2001 recession never saw catastrophically rapid falls in employment, it continued to decline for a remarkably long time.

That’s why it’s useful to compare recessions in terms of their cumulative declines from peak:

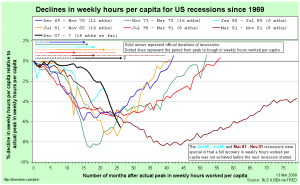
Comparing US recessions relative to actual peaks in weekly hours worked per capitaA few points to note:

  • The figures are relative to the actual peak in weekly hours worked per capita, not to the official (NBER-determined) peak in economic activity.
  • I have shown the official recession durations (solid arrows) and the actual periods of declining weekly hours worked per capita (dotted lines) at the top.
  • The 1980 and 2001 recessions were odd in that weekly hours worked per capita never fully recovered before the next recession started.

The fact that the current recession isn’t yet quite as bad as the 1981/82 recession is a little clearer here.  The 1973-75 recession stands out as being worse than the current one and the 2001 recession was clearly the worst of all.

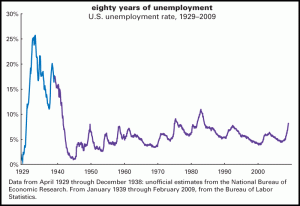
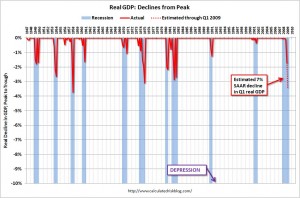
There’s also some question over the US is actually in a depression rather than just a recession.  The short answer is no, or at least not yet.  There is no official definition of a depression, but a cumulative decline of 10% in real GDP is often bandied around as a good rule of thumb.  Here are two diagrams that illustrate just how much worse things would need to be before the US was really in a depression …

First, from The Liscio Report, we have an estimated unemployment rate time-series that includes the Great Depression:

Historic Unemployment Rates in the USA

Second, from Calculated Risk, we have a time-series of cumulative declines in real gdp since World War II:

Cumulative declines in real GDP (USA)

Remember that we’d need to fall to -10% to hit the common definition of a depression.

Is economics looking at itself?

Patricia Cowen recently wrote a piece for the New York Times:  “Ivory Tower Unswayed by Crashing Economy

The article contains precisely what you might expect from a title like that.  This snippet gives you the idea:

The financial crash happened very quickly while “things in academia change very, very slowly,” said David Card, a leading labor economist at the University of California, Berkeley. During the 1960s, he recalled, nearly all economists believed in what was known as the Phillips curve, which posited that unemployment and inflation were like the two ends of a seesaw: as one went up, the other went down. Then in the 1970s stagflation — high unemployment and high inflation — hit. But it took 10 years before academia let go of the Phillips curve.

James K. Galbraith, an economist at the Lyndon B. Johnson School of Public Affairs at the University of Texas, who has frequently been at odds with free marketers, said, “I don’t detect any change at all.” Academic economists are “like an ostrich with its head in the sand.”

“It’s business as usual,” he said. “I’m not conscious that there is a fundamental re-examination going on in journals.”

Unquestioning loyalty to a particular idea is what Robert J. Shiller, an economist at Yale, says is the reason the profession failed to foresee the financial collapse. He blames “groupthink,” the tendency to agree with the consensus. People don’t deviate from the conventional wisdom for fear they won’t be taken seriously, Mr. Shiller maintains. Wander too far and you find yourself on the fringe. The pattern is self-replicating. Graduate students who stray too far from the dominant theory and methods seriously reduce their chances of getting an academic job.

My reaction is to say “Yes.  And No.”  Here, for example, is a small list of prominent economists thinking about economics (the position is that author’s ranking according to ideas.repec.org):

There are plenty more. The point is that there is internal reflection occurring in economics, it’s just not at the level of the journals.  That’s for a simple enough reason – there is an average two-year lead time for getting an article in a journal.  You can pretty safely bet a dollar that the American Economic Review is planning a special on questioning the direction and methodology of economics.  Since it takes so long to get anything into journals, the discussion, where it is being made public at all, is occurring on the internet.  This is a reason to love blogs.

Another important point is that we are mostly talking about macroeconomics.  As I’ve mentioned previously, I pretty firmly believe that if you were to stop an average person on the street – hell, even an educated and well-read person – to ask them what economics is, they’d supply a list of topics that encompass Macroeconomics and Finance.

The swathes of stuff on microeconomics – contract theory, auction theory, all the stuff on game theory, behavioural economics – and all the stuff in development (90% of development economics for the last 10 years has been applied micro), not to mention the work in econometrics; none of that would get a mention.  The closest that the person on the street might get to recognising it would be to remember hearing about (or possibly reading) Freakonomics a couple of years ago.

How to value toxic assets (part 6)

Via Tyler Cowen, I am reminded (again) that I should really be reading Steve Waldman more often.  Like, all the time.  After reading John Hempton’s piece that I highlighted last time, Waldman writes, as an afterthought:

There’s another way to generate price transparency and liquidity for all the alphabet soup assets buried on bank balance sheets that would require no government lending or taxpayer risk-taking at all. Take all the ABS and CDOs and whatchamahaveyous, divvy all tranches into $100 par value claims, put all extant information about the securities on a website, give ’em a ticker symbol, and put ’em on an exchange. I know it’s out of fashion in a world ruined by hedge funds and 401-Ks and the unbearable orthodoxy of index investing. But I have a great deal of respect for that much maligned and nearly extinct species, the individual investor actively managing her own account. Individual investors screw up, but they are never too big to fail. When things go wrong, they take their lumps and move along. And despite everything the professionals tell you, a lot of smart and interested amateurs could build portfolios that match or beat the managers upon whose conflicted hands they have been persuaded to rely. Nothing generates a market price like a sea of independent minds making thousands of small trades, back and forth and back and forth.

I don’t really expect anybody to believe me, but I’ve been thinking something similar.

CDOs, CDOs-squared and all the rest are derrivatives that are traded over the counter; that is, they are traded entirely privately.  If bank B sells some to hedge fund Y, nobody else finds out any details of the trade or even that the trade took place.  The closest we come is that when bank B announces their quarterly accounts, we might realise that they off-loaded some assets.

On the more popularly known stock and bond markets, buyers publicly post their “bid” prices and sellers post their “ask” prices. When the prices meet, a trade occurs.[*1] Most details of the trade are then made public – the price(s), the volume, the particular details of the asset (ordinary shares in XXX, 2-year senior notes from XXX with an expiry of xx/xx/xxxx, etc) – everything except the identity of the buyer and seller. Those details then provide some information to everybody watching on how the buyer and seller value the asset. Other market players can then combine that with their own private valuations and update their own bid or ask prices accordingly. In short, the market aggregates information. [*2]

When assets are traded over the counter (OTC), each participant can only operate on their private valuation. There is no way for the market to aggregate information in that situation. Individual banks might still partially aggregate information by making a lot of trades with a lot of other institutions, since each time they trade they discover a bound on the valuation of the other party (an upper bound when you’re buying and the other party is selling, a lower bound when you’re selling and they’re buying).

To me, this is a huge failure of regulation. A market where information is not publicly and freely available is an inefficient market, and worse, one that expressly creates an incentive for market participants to confuse, conflate, bamboozle and then exploit the ignorant. Information is a true public good.

On that basis, here is my idea:

Introduce new regulation that every financial institution that wants to get support from the government must anonymously publish all details of every trade that they’re party to. The asset type, the quantity, the price, any time options on the deal, everything except the identity of the parties involved. Furthermore, the regulation would be retroactive for X months (say, two years, so that we get data that predates the crisis).  On top of that, the regulation would require that every future trade from everyone (whether they were receiving government assistance or not) would be subject to the same requirementes.  Then everything acts pretty much like the stock and bond markets.

The latest edition of The Economist has an article effectively questioning whether this is such a good idea.

[T]ransparency and liquidity are close relatives. One enemy of liquidity is “asymmetric information”. To illustrate this, look at a variation of the “Market for Lemons” identified by George Akerlof, a Nobel-prize-winning economist, in 1970. Suppose that a wine connoisseur and Joe Sixpack are haggling over the price of the 1998 Château Pétrus, which Joe recently inherited from his rich uncle. If Joe and the connoisseur only know that it is a red wine, they may strike a deal. They are equally uninformed. If vintage, region and grape are disclosed, Joe, fearing he will be taken for a ride, may refuse to sell. In financial markets, similarly, there are sophisticated and unsophisticated investors, and unless they have symmetrical information, liquidity can dry up. Unfortunately transparency may reduce liquidity. Symmetry, not the amount of information, matters.

I’m completely okay with this. Symmetric access to information and symmetric understanding of that information is the ideal. From the first paragraph and then the last paragraph :

… Not long ago the cheerleaders of opacity were the loudest. Without privacy, they argued, financial entrepreneurs would be unable to capture the full value of their trading strategies and other ingenious intellectual property. Forcing them to disclose information would impair their incentive to uncover and correct market inefficiencies, to the detriment of all …

Still, for all its difficulties, transparency is usually better than the alternative. The opaque innovations of the recent past, rather than eliminating market inefficiencies, unintentionally created systemic risks. The important point is that financial markets are not created equal: they may require different levels of disclosure. Liquidity in the stockmarket, for example, thrives on differences of opinion about the value of a firm; information fuels the debate. The money markets rely more on trust than transparency because transactions are so quick that there is little time to assess information. The problem with hedge funds is that a lack of information hinders outsiders’ ability to measure their contribution to systemic risk. A possible solution would be to impose delayed disclosure, which would allow the funds to profit from their strategies, provide data for experts to sift through, and allay fears about the legality of their activities. Transparency, like sunlight, needs to be looked at carefully.

This strikes me as being around the wrong way.  Money markets don’t rely on trust because their transactions are so fast; their transactions are so fast because they’re built on trust.  The scale of the crisis can be blamed, in no small measure, because of the breakdown in that trust.

I also do not buy the idea of opacity begetting market efficiency.  It makes no sense.  The only way that information disclosure can remove the incentive to “uncover and correct” inefficiencies in the market is if by making the information public you reduce the inefficiency.  I’m not suggesting that we force market participants to reveal what they discover before they get the chance to act on it.  I’m only suggesting that the details of their action should be public.

[*1] Okay, it’s not exactly like that, but it’s close enough.

[*2] Note that information aggregation does not necessarily imply that the Efficient Market Hypothesis (EMH), but the EMH requires information aggregation to work.

Other posts in this series:  1, 2, 3, 4, 5, [6].

Whyte is wrong to think that Brown is wrong

Writing in Friday’s FT, Jamie Whyte argues that Gordon Brown is wrong to think that regulating bankers’ bonuses to stop the culture of short-term thinking will avoid future financial crises.  He writes:

[I]magine you are the manager of a lottery company. Your job is similar to a banker’s. You sell tickets (make loans) that have a certain probability of winning a prize (of defaulting). To ensure long-run profits, you must set a price for the tickets (charge a rate of interest) that is sufficient to pay out the lottery winnings (cover the cost of defaulting borrowers).

But suppose you were a greedy lottery company manager, concerned more with your own bonus than with your shareholders’ interests. Here is a trick you might play. Offer jackpots, ticket odds and ticket prices that in effect give your customers money. For example, offer $1 tickets with a one-in-5m chance of winning a $10m prize. A one-in-5m chance of winning $10m is worth $2 . So each ticket represents a gift of $1 to its purchaser.

With such an attractive “customer value proposition” you would leave your competitors for dead. And if you limited ticket sales to, say, 1m a year, the chances are no one would win the prize. In most years you will earn $1m in ticket sales and pay nothing in prizes. When someone finally wins the $10m prize, and your company collapses, that will be a problem for shareholders and creditors; you will probably have pocketed a few nice bonuses already.

To prevent such wickedness, Mr Brown may insist that lottery managers be paid bonuses on the basis of long-term profits: five years’, let us say. No problem: simply set the prize at $100m and the chance of winning at one in 50m. Then you will be unlucky if anyone wins in a five-year period, and you can be confident of walking away with a fat bonus.

This is why, even if Mr Brown were right that short-term bonus plans caused the financial crisis, his proposed remedy would not help. Whatever time frame he mandates, it will always be too short. For, like lottery managers, bank managers can manipulate the “risk profile” of the bank so that large losses, although inevitable in the long run, are unlikely during the mandated period.

I like Mr. Whyte’s analogy, but as far as I can see, there are three problems in his logic.  For the sake of some numbers to talk about, I’ll consider the idea of a five-year delay in high-end bankers having access to their bonuses.

First, he’s missing the fact that for his lottery company to offer a prize of $100 million, it’s going to need some backers with much deeper pockets than if his prize is only $10 million.  Whyte quite correctly points out that risk has been mispriced, but provided that it’s got some price, scaling up without a larger customer pool (the equivalent of increasing the leverage of your bank) must come with extra costs.  Even if the wholesale market is willing to stand behind you, one option is to increase the duration until the size needed to outflank it would require bank mergers that would run foul of competition law.

Second, a key feature long-term bonuses is that they accumulate.   If bonuses are awarded annually but placed into escrow for five years, then even if the bad event doesn’t happen until year 10, there will be five years of bonuses available for claw-back.  All the bankers are currently giving up one year of bonuses.  By putting bonuses to one side, we magnify the value at risk faced by the bankers themselves.

Third, we need to recognise that nobdy lives forever, and while one year might not be so long when measured against a career, five years is a serious block of time.  The reputational effects of any failure would be increased and, I hope, institutional memory would be improved.

As I say, I agree that a mispricing of risk lies at the heart of the credit crisis.  I simply disagree with Mr. Whyte on why it occured.  I’m not sure why he thinks it occured, but I think that part of the cause is the short-term nature of bank incentives.

How to value toxic assets (part 5)

John Hempton has an excellent post on valuing the assets on banks’ balance sheets and whether banks are solvent.  He starts with a simple summary of where we are:

We have a lot of pools of bank assets (pools of loans) which have the following properties:
  • The assets sit on the bank’s balance sheet with a value of 90 – meaning they have either being marked down to 90 (say mark to mythical market or model) or they have 10 in provisions for losses against them.
  • The same assets when they run off might actually make 75 – meaning if you run them to maturity or default the bank will – discounted at a low rate – recover 75 cents in the dollar on value.

The banks are thus under-reserved on an “held to maturity” basis. Heavily under-reserved.

He then gives another explanation (on top of the putting-Humpty-Dumpty-back-together-again idea I mentioned previously) of why the market price is so far below the value that comes out of standard asset pricing:

Before you go any further you might wonder why it is possible that loans that will recover 75 trade at 50? Well its sort of obvious – in that I said that they recover 75 if the recoveries are discounted at a low rate. If I am going to buy such a loan I probably want 15% per annum return on equity.

The loan initially yielded say 5%. If I buy it at 50 I get a running yield of 10% – but say 15% of the loans are not actually paying that yield – so my running yield is 8.5%. I will get 75-80c on them in the end – and so there is another 25cents to be made – but that will be booked with an average duration of 5 years – so another 5% per year. At 50 cents in the dollar the yield to maturity on those bad assets is about 15% even though the assets are “bought cheap”. That is not enough for a hedge fund to be really interested – though if they could borrow to buy those assets they might be fun. The only problem is that the funding to buy the assets is either unavailable or if available with nasty covenants and a high price. Essentially the 75/50 difference is an artefact of the crisis and the unavailability of funding.

The difference between the yield to maturity value of a loan and its market value is extremely wide. The difference arises because you can’t eaily borrow to fund the loans – and my yield to maturity value is measured using traditional (low) costs of funds and market values loans based on their actual cost of funds (very high because of the crisis).

The rest of Hempton’s piece speaks about various definitions of solvency, whether (US) banks meet each of those definitions and points out the vagaries of the plan recently put forward by Geithner.  It’s all well worth reading.

One of the other important bits:

Few banks would meet capital adequacy standards. Given the penalty for even appearing as if there was a chance that you would not meet capital adequacy standards is death (see WaMu and Wachovia) and this is a self-assessed exam, banks can be expected not to tell the truth.

(It was Warren Buffett who first – at least to my hearing – described financial accounts as a self-assessed exam for which the penalty for failure is death. I think he was talking about insurance companies – but the idea is the same. Truth is not expected.)

Other posts in this series:  1, 2, 3, 4, [5], 6.

Perspective (Comparing Recessions)

This is quite a long post.  I hope you’ll be patient and read it all – there are plenty of pretty graphs!

I have previously spoken about the need for some perspective when looking at the current recession.  At the time (early Dec 2008), I was upset that every regular media outlet was describing the US net job losses of 533k in November as being unprecedentedly bad when it clearly wasn’t.

About a week ago, the office of Nancy Pelosi (the Speaker of the House of Representatives in the US) released this graph, which makes the current recession look really bad:
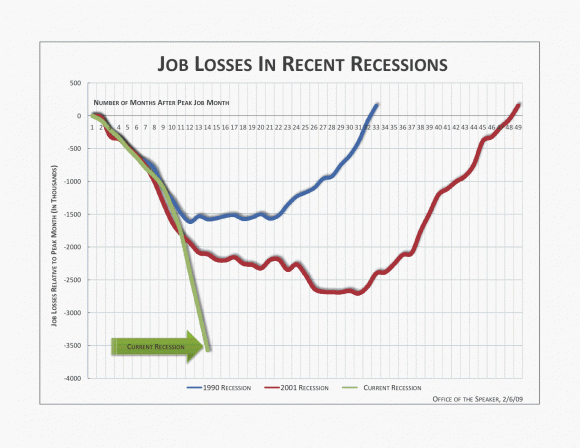
Notice that a) the vertical axis lists the number of jobs lost and b) it only includes the last three recessions.  Shortly afterward, Barry Ritholtz posted a graph that still had the total number of jobs lost on the vertical axis, but now included all post-World War Two recessions:
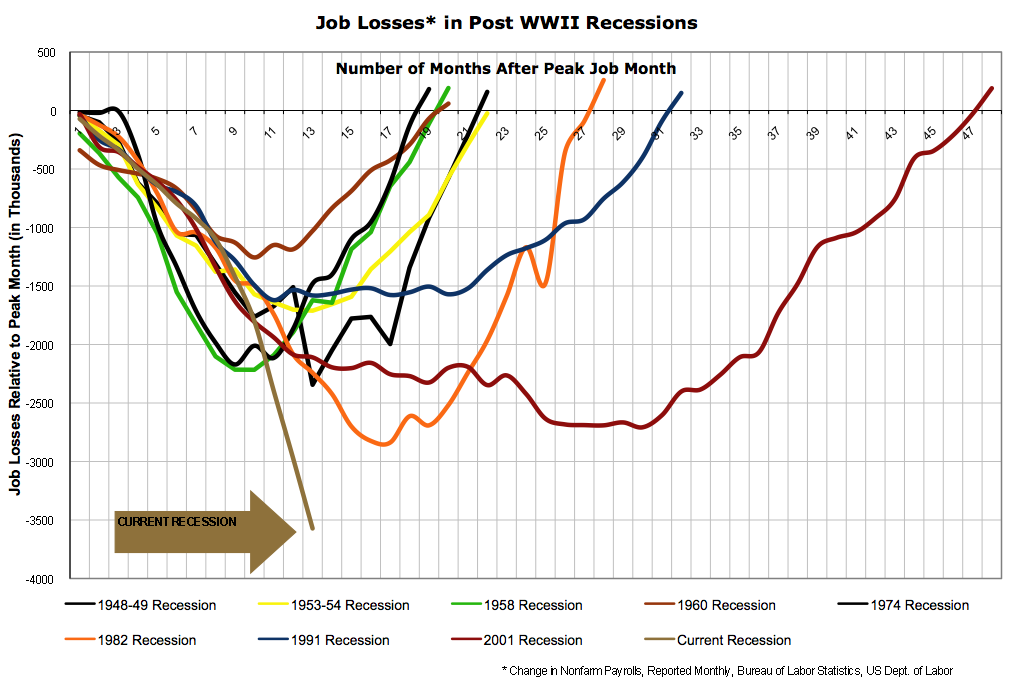
Including all the recessions is an improvement if only for the sake of context, but displaying total job losses paints a false picture for several reasons:

  1. Most importantly, it doesn’t allow for increases in the population.  The US residential population in 1974 was 213 million, while today it is around 306 million.  A loss of 500 thousand jobs in 1974 was therefore a much worse event than it is today.
  2. Until the 1980s, most households only had one source of labour income.  Although the process started slowly much earlier, in the 1980s very large numbers of women began to enter the workforce, meaning that households became more likely to have two sources of labour income.  As a result, one person in a household losing their job is not as catastrophic today as it used to be.
  3. There has also been a general shift away from full-time work and towards part-time work.  Only looking at the number of people employed (or, in this case, fired) means that we miss altogether the impact of people having their hours reduced.
  4. We should also attempt to take into account discouraged workers; i.e. those who were unemployed and give up even looking for a job.

Several people then allowed for the first of those problems by giving graphs of job loses as percentages of the employment level at the peak of economic activity before the recession.  Graphs were produced, at the least, by Justin Fox, William Polley and Calculated Risk.  All of those look quite similar.  Here is Polley’s:
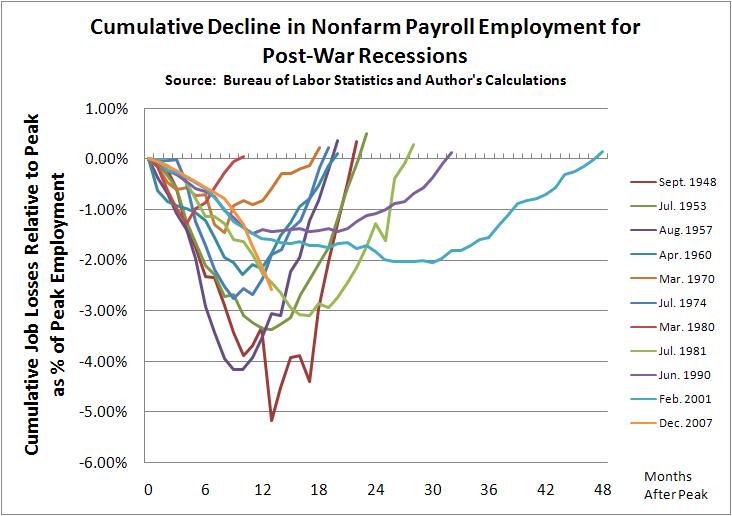
The current recession is shown in orange.  Notice the dramatic difference to the previous two graphs?  The current recession is now shown as being quite typical; painful and worse than the last two recessions, but entirely normal.  However, this graph is still not quite right because it still fails to take into account the other three problems I listed above.

(This is where my own efforts come in)

The obvious way to deal with the rise of part-time work is to graph (changes in) hours worked rather than employment.

The best way to also deal with the entry of women into the workforce is to graph hours worked per member of the workforce or per capita.

The only real way to also (if imperfectly) account for discouraged workers is to just graph hours worked per capita (i.e. to compare it to the population as a whole).

This first graph shows Weekly Hours Worked per capita and per workforce member since January 1964:
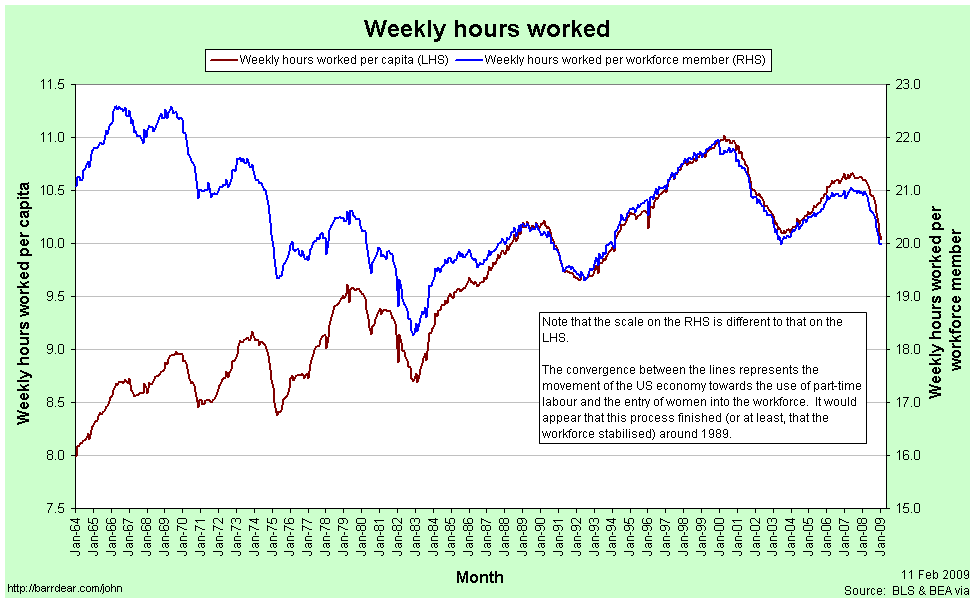
In January 1964, the average member of the workforce worked just over 21 hours per week.  In January 2009 they worked just under 20 hours per week.

The convergence between the two lines represents the entry of women into the workforce (the red line is increasing) and the increasing prevalence of part-time work (the blue line is decreasing).  Each of these represented a structural change in the composition of the labour force.  The two processes appear to have petered out by 1989. Since 1989 the two graphs have moved in tandem.

[As a side note: In econometrics it is quite common to look for a structural break in some timeseries data.  I’m sure it exists, but I am yet to come across a way to rigorously handle the situation when the “break” takes decades occur.]

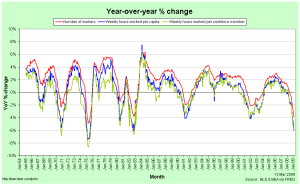
The next graph shows Year-over-Year percentage changes in the number of employed workers, the weekly hours per capita and the weekly hours per workforce member:
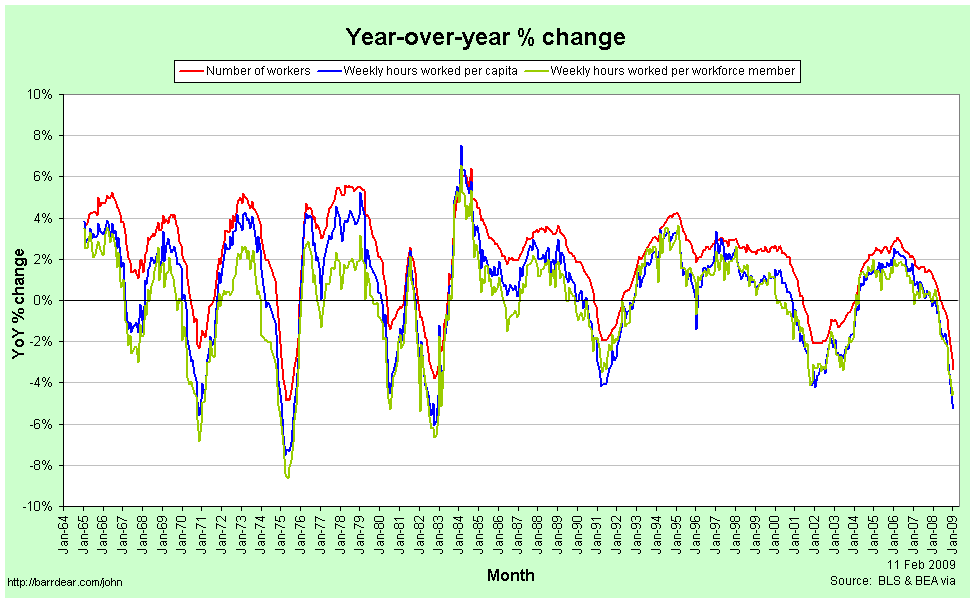
Note that changes in the number of workers are consistently higher than the number of hours per workforce member or per capita.  In a recession, people are not just laid off, but the hours that the remaining employees are given also falls, so the average number of hours worked falls much faster.  In a boom, total employment rises faster than the average number of hours, meaning that the new workers are working few hours than the existing employees.

This implies that the employment situation faced by the average individual is consistently worse than we might think if we restrict our attention to just the number of people in any kind of employment.  In particular, it means that from the point of view of the average worker, recessions start earlier, are deeper and last longer than they do for the economy as a whole.

Here is the comparison of recessions since 1964 from the point of view of Weekly Hours Worked per capita, with figures relative to those in the month the NBER determines to be the peak of economic activity:
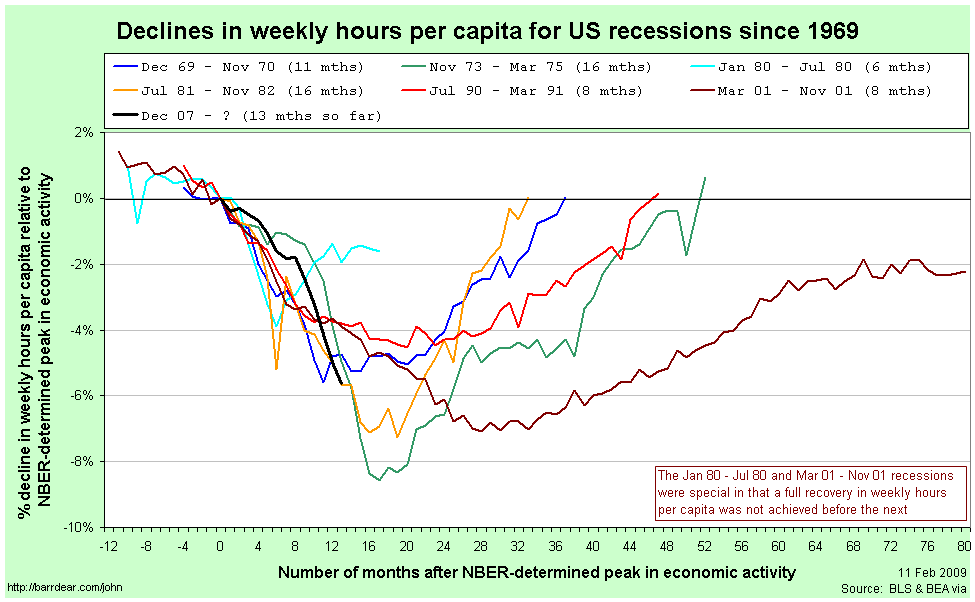
The labels for each line are the official (NBER-determined) start and end dates for the recession.  There are several points to note in comparing this graph to those above:

  • The magnitudes of the declines are considerably worse than when simply looking at aggregate employment.
  • Declines in weekly hours worked per capita frequently start well before the NBER-determined peak in economic activity.  For the 2001 recession, the decline started 11 months before the official peak.
  • For two recessions out of the last seven – those in 1980 and 2001 – the recovery never fully happened; another recession was deemed to have started before the weekly hours worked climbed back to its previous peak.
  • The 2001 recession was really awful.
  • The current recession would appear to still be typical.

Since so many of the recessions started – from the point of view of the average worker – before the NBER-determined date, it is helpful to rebase that graph against the actual peak in weekly hours per capita:
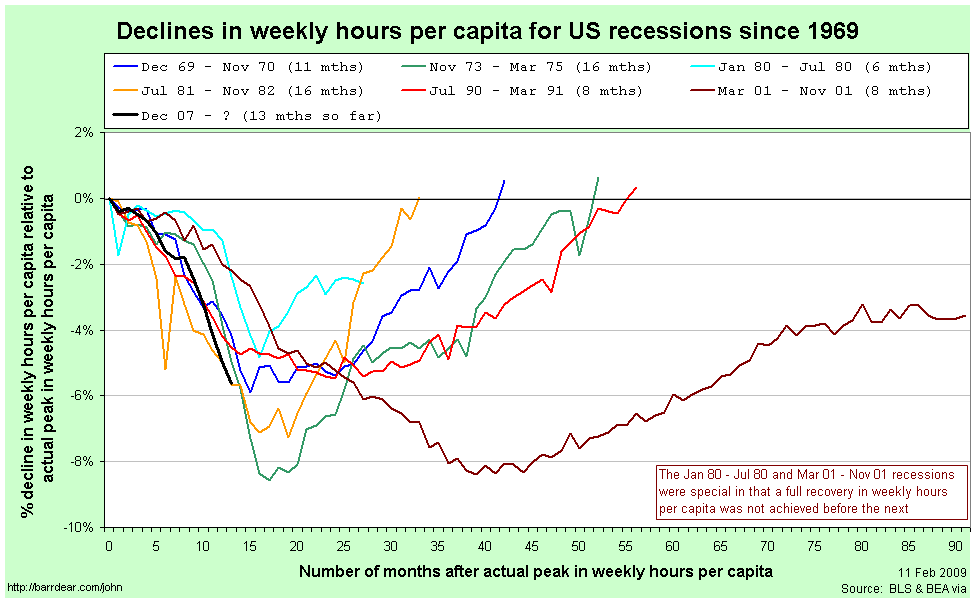
Now, finally, we have what I believe is an accurate comparison of the employment situation in previous recessions.

Once again, the labels for each line are the official (NBER-determined) start and end dates for the recession.  By this graph, the 2001 recession is a clear stand-out.  It fell the second furthest (and almost the furthest), lasted by far the longest and the recovery never fully happened.

The current recession also stands out as being toward the bad end of the spectrum.  It is the equally worst recession by this point since the peak.  It will need to continue getting a lot worse quite quickly in order to maintain that record, however.

After seeing Calculated Risk’s graph, Barry Ritholtz asked whether it is taking longer over time to recover from a recession recoveries (at least in employment).  This graph quite clearly suggests that the answer is “no.”  While the 2001 and 1990/91 recessions do have the slowest recoveries, the next two longest are the earliest.

Perhaps a better way to characterise it is to compare the slope coming down against the slope coming back up again.  It seems as a rough guess that rapid contractions are followed by just-as-rapid rises.  On that basis, at least, we have some slight cause for optimism.

If anybody is interested, I have also uploaded a copy of the spreadsheet with all the raw data for these graphs.  You can access it here:  US Employment (excel spreadsheet)

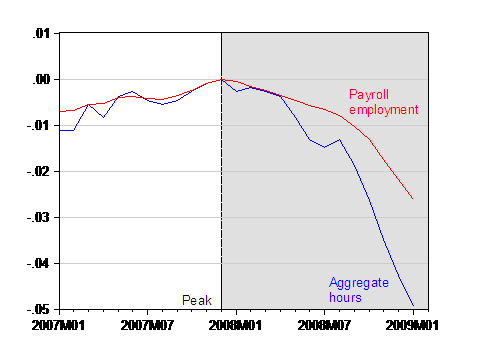
For reference, the closest other things that I have seen to this presentation in the blogosphere are this post by Spencer at Angry Bear and this entry by Menzie Chinn at EconBrowser.  He provides this graph of employment versus aggregate hours for the current recession only:
Alex Tabarrok has also been comparing recessions (1, 2, 3).
The velocity of money and the credit crisis

This is another one for my students of EC102.

Possibly the simplest model of aggregate demand in an economy is this equation:

MV = PY

The right-hand side is the nominal value of demand, being the price level multiplied by the real level of demand.  The left-hand side has the stock of money multiplied by the velocity of money, which is the number of times the average dollar (or pound, or euro) goes around the economy in a given time span.  The equation isn’t anything profound.  It’s an accounting identity that is always true, because V is constructed in order to make it hold.

The Quantity Theory of Money (QTM) builds on that equation.  The QTM assumes that V and Y are constant (or at least don’t respond to changes in M) and observes that, therefore, any change in M must only cause a corresponding change in P.  That is, an increase in the money supply will only result in inflation.

A corresponding idea is that of Money Neutrality.  If money is neutral, then changes in the money supply do not have any effect on real variables.  In this case, that means that a change in M does not cause a change in Y.  In other words, the neutrality of money is a necessary, but not sufficient condition for the QTM to hold; you also need the velocity of money to not vary with the money supply.

After years of research and arguing, economists generally agree today that money neutrality does not hold in the short run (i.e. in the short run, increasing the money supply does increase aggregate demand), but that it probably does hold in the long run (i.e. any such change in aggregate demand will only be temporary).

The velocity of money is an interesting concept, but it’s fiendishly difficult to tie down.

  • In the long-run, it has a secular upward trend (which is why the QTM doesn’t hold in the long run, even if money neutrality does).
  • It is extremely volatile in the short-run.
  • Since it is constructed rather than measured, it is a residual in the same way that Total Factor Productivity is a residual.  It is therefore a holding place for any measurement error in the other three variables.  This will be part, if not a large part, of the reason why it is so volatile in the short-run.
  • Nevertheless, the long run increases are pretty clearly real (i.e. not a statistical anomaly). We assume that this a result of improvements in technology.
  • Conceptually, a large value for V is representative of an efficient financial sector. More accurately, a large V is contingent on an efficient turn-around of money by the financial sector – if a new deposit doesn’t go out to a new loan very quickly, the velocity of money is low. The technology improvements I mentioned in the previous point are thus technologies specific to improving the efficiency of the finance industry.
  • As you might imagine, the velocity of money is also critically dependent on confidence both within and regarding banks.
  • Finally, the velocity of money is also related to the concept of fractional reserve banking, since we’re talking about how much money gets passed on via the banks for any given deposit.  In essence, the velocity of money must be positively related to the money multiplier.

Those last few points then feed us into the credit crisis and the recession we’re all now suffering through.

It’s fairly common for some people to blame the crisis on a global savings glut, especially after Ben Bernanke himself mentioned it back in 2005.  But, as Brad Setser says, “the debtor and the creditor tend to share responsibility for most financial crises. One borrows too much, the other lends too much.”

So while large savings in East-Asian and oil-producing countries may have been a push, we can use the idea of the velocity of money to think about the pull:

  1. There was some genuine innovation in the financial sector, which would have increased V even without any change in attitudes.
  2. Partially in response to that innovation, partially because of a belief that thanks to enlightened monetary policy aggregate uncertainty was reduced and, I believe, partially buoyed by the broader sense of victory of capitalism over communism following the fall of the Soviet Union, confidence both within and regarding the financial industry also rose.
  3. Both of those served to increase the velocity of money and, with it, real aggregate demand even in the absence of any especially loose monetary policy.
  4. Unfortunately, that increase in confidence was excessive, meaning that the increases in demand were excessive.
  5. Now, confidence both within and, in particular, regarding the banking sector has collapsed.  The result is a fall in the velocity of money (for any given deposit received, a bank is less likely to make a loan) and consequently, aggregate demand suffers.