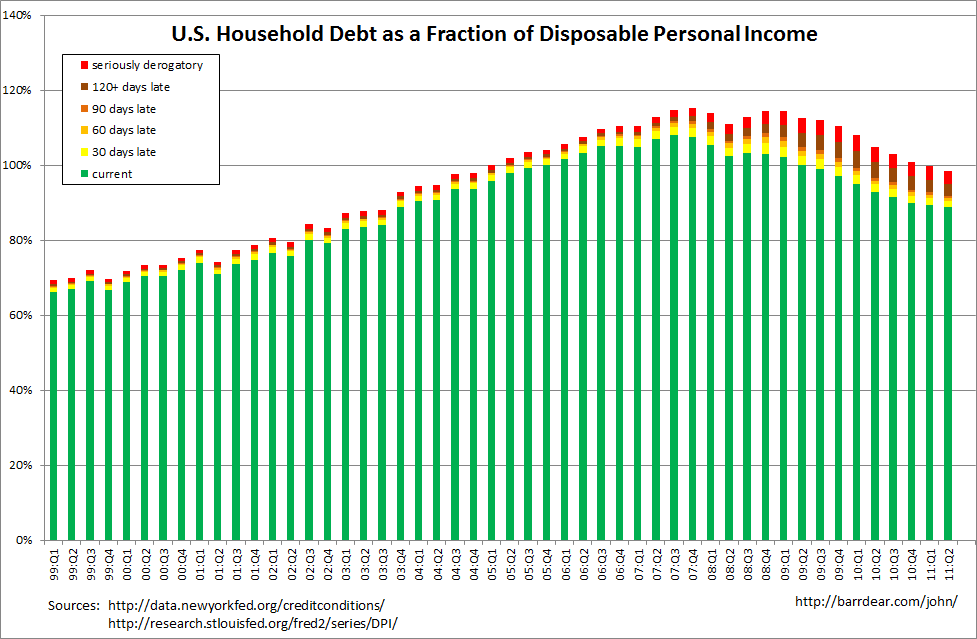
In today’s story of household “deleveraging” in America (okay, so this is very, very late since the data were released in August. Still … ):
2011q2 was the first time since 2004q4 that U.S. Household debt was less than 100% of Disposable Personal Income (click on the image for a less squished version):

2005q1 and 2011q1 were both at 100% exactly, or close enough.
In the period 1999q2 to 2006q3, distressed household debt averaged 4.35% and was never higher than 5.06%. Distressed household debt was at 9.86% in 2011q2, having peaked at 11.98% in 2009q4. As the Fed’s credit conditions report highlights, that was the 6th straight quarter of improvement. However, the quarter-to-quarter falls have been quite low: 0.04 percentage points (2009q4 to 2010q1), 0.58 p.p., 0.26 p.p., 0.31 p.p., 0.31 p.p. and 0.62 p.p. (2011q1 to 2011q2). If we assume a continuing fall of 0.4 percentage points per quarter, it’ll take another 14 quarters – that’s 2014q4 – to return to the pre-crisis average.
Of course, a resumption of growth in consumption is not contingent on that happening (maybe we’ll see a jump in incomes for some reason – I’m looking at you, policy makers), but it’s still pretty depressing.
Crucially, too, everything here only looks at aggregate, or average, numbers and if you think the balance-sheet recession story carries any weight at all, you should be very, very interested in the distributional effects.