Greg Mankiw has a brief note (I’ll include it verbatim):
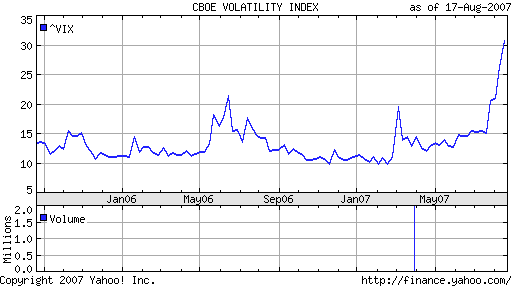
This is the VIX index, which uses options prices to measure expected stock market volatility over the next 30 days. The latest run-up is striking. It suggests that the recent bumpy ride in financial markets is likely to continue for a while.
I had never heard of the VIX Index before (yet another thing to add to the shamefully-ignorant-about pile), but I do notice that while the 2-year graph Prof. Mankiw includes makes the current turmoil look unprecedented, it’s actually nothing of the sort. Here’s the same graph over the maximum possible period:
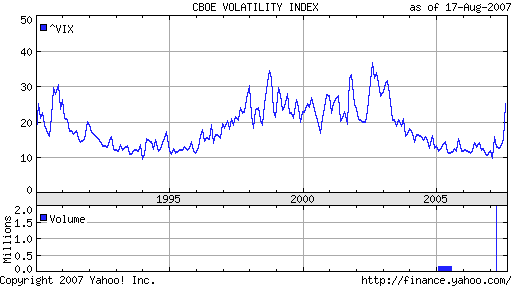
Looking at this, the recent brouhaha is certainly serious, but is also certainly no worse (yet) than we’ve had before. The LTCM (1998) and 9/11 (2001) events are clearly discernible. Other than those two, I have no idea why volatility was so high between 1997 and 2003, or why it spiked in 1990 (something to do with the then-upcoming recession?).